My Dashboard
Overview
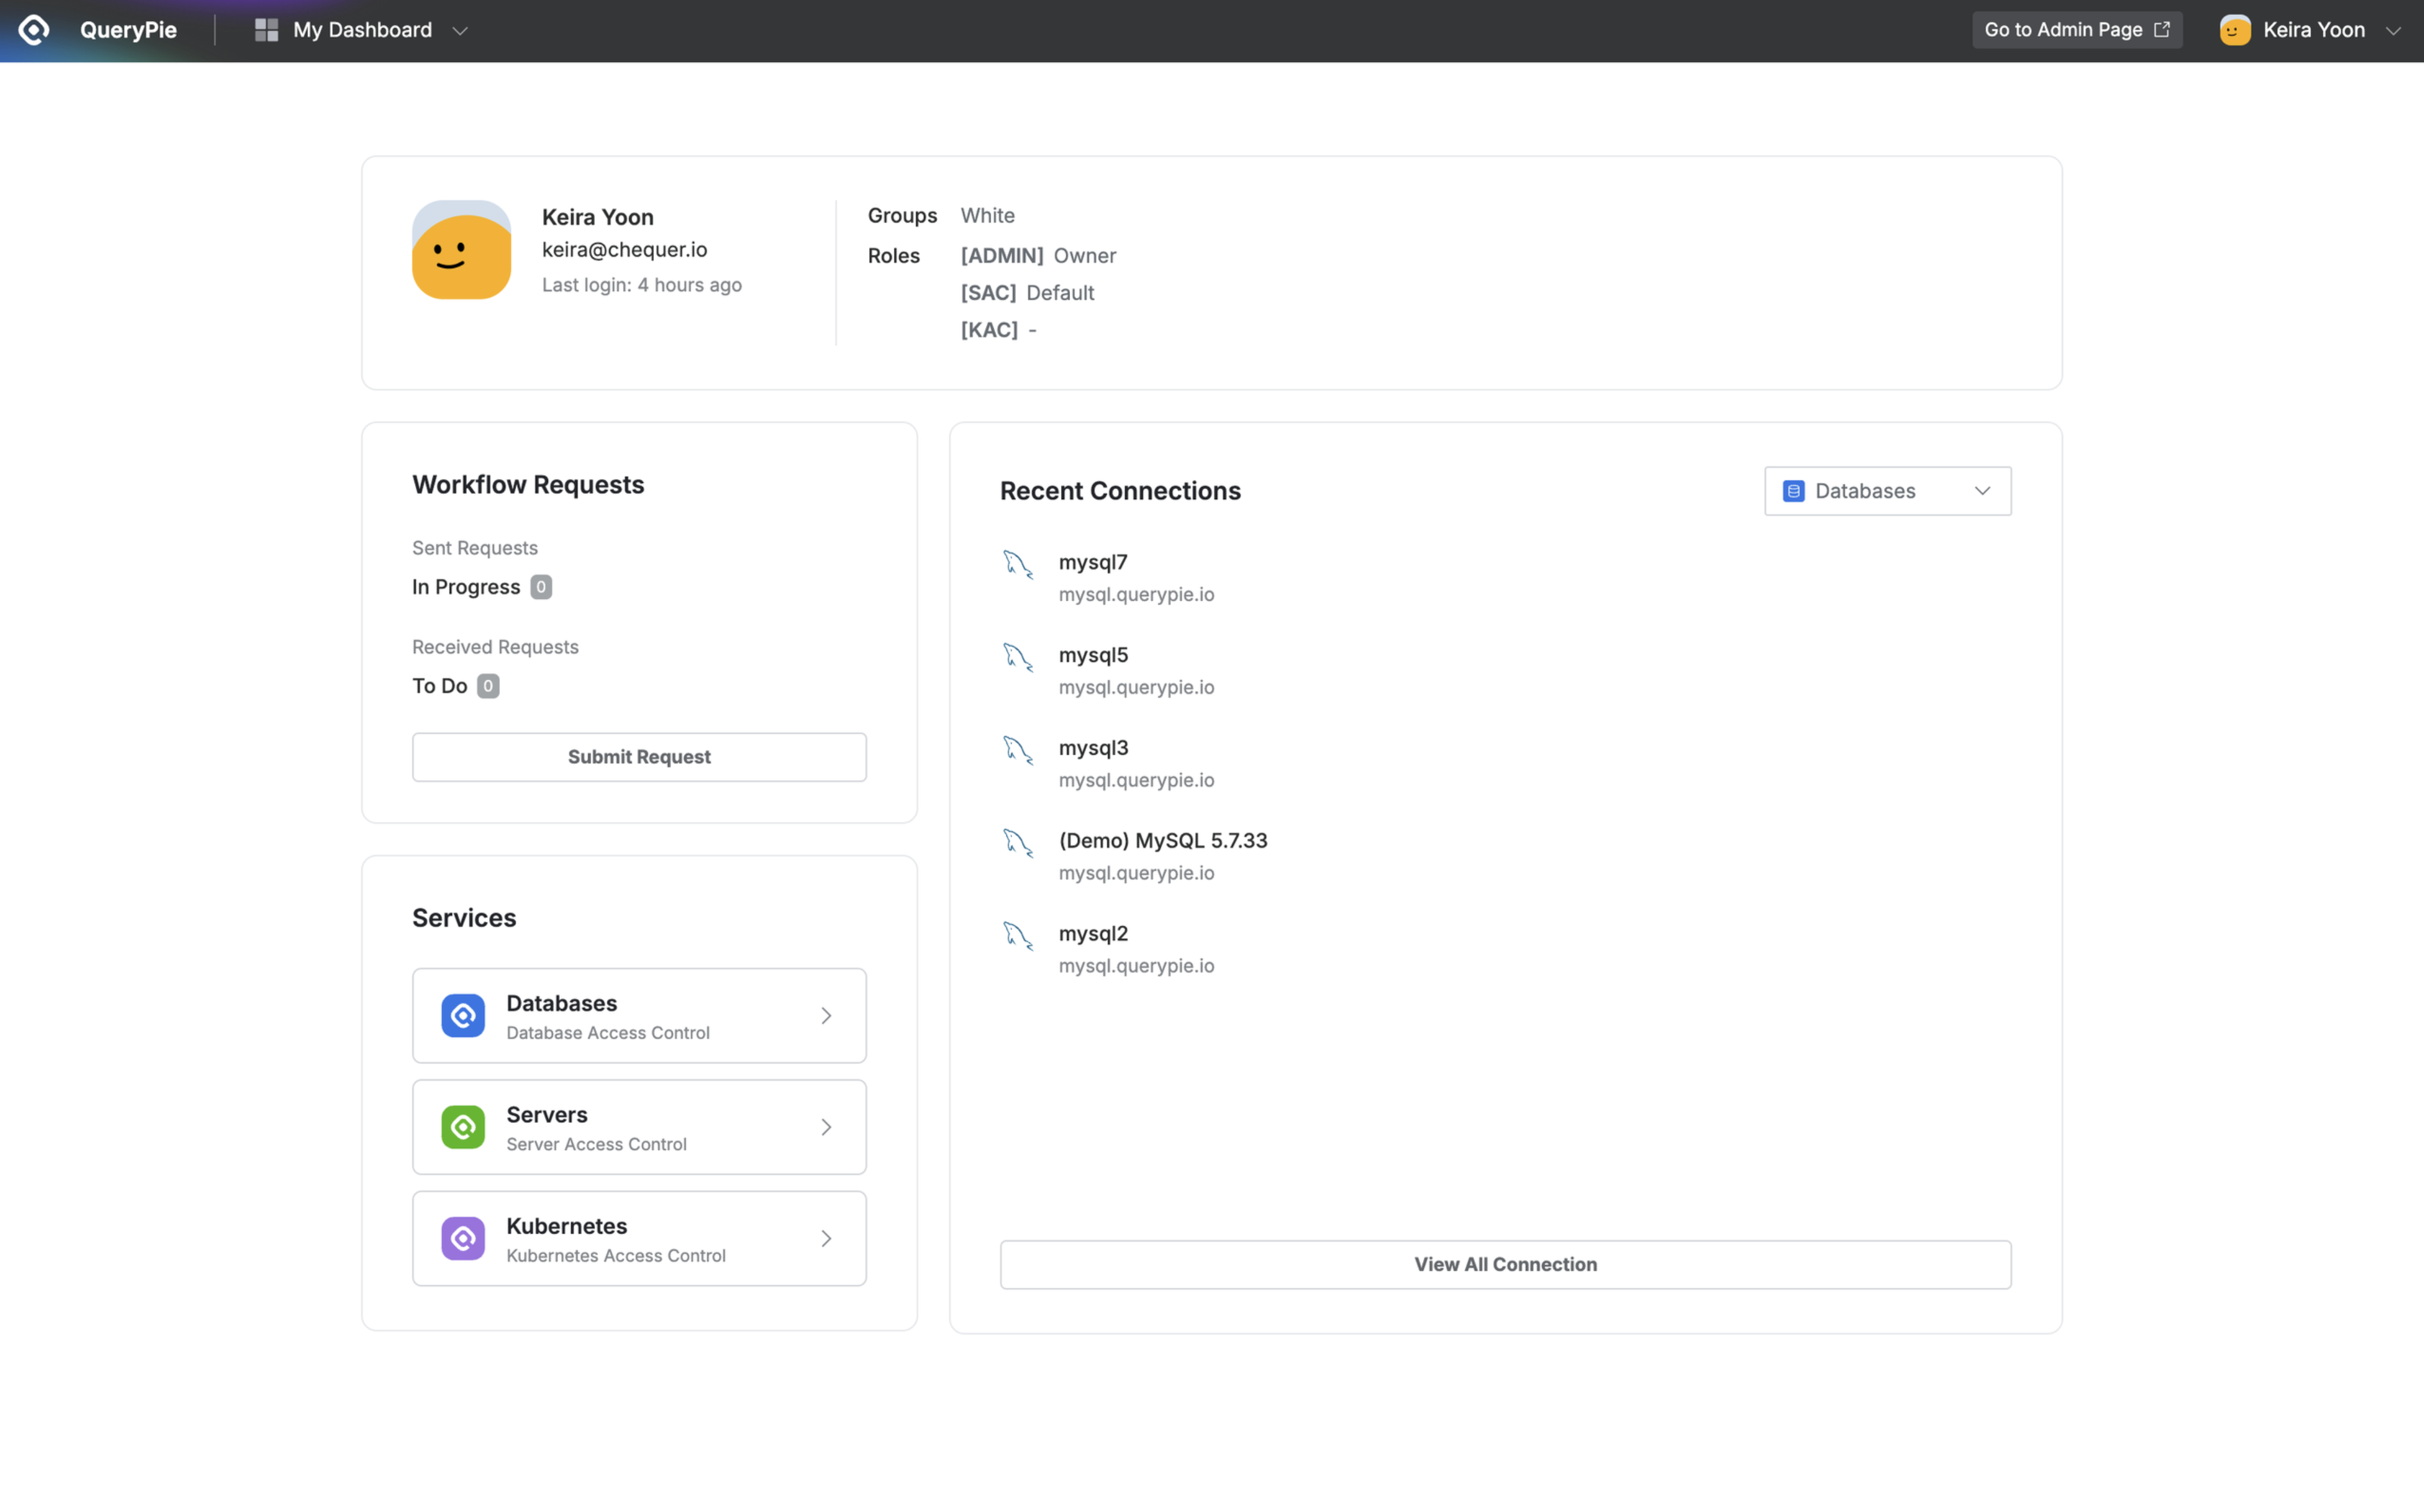
Once you successfully log in to QueryPie Web, you will be directed to the user dashboard. The dashboard provides an overview of essential information, such as the roles assigned to the currently logged-in user, their associated groups, approval status, and a list of recent connections.
Logging into QueryPie Web
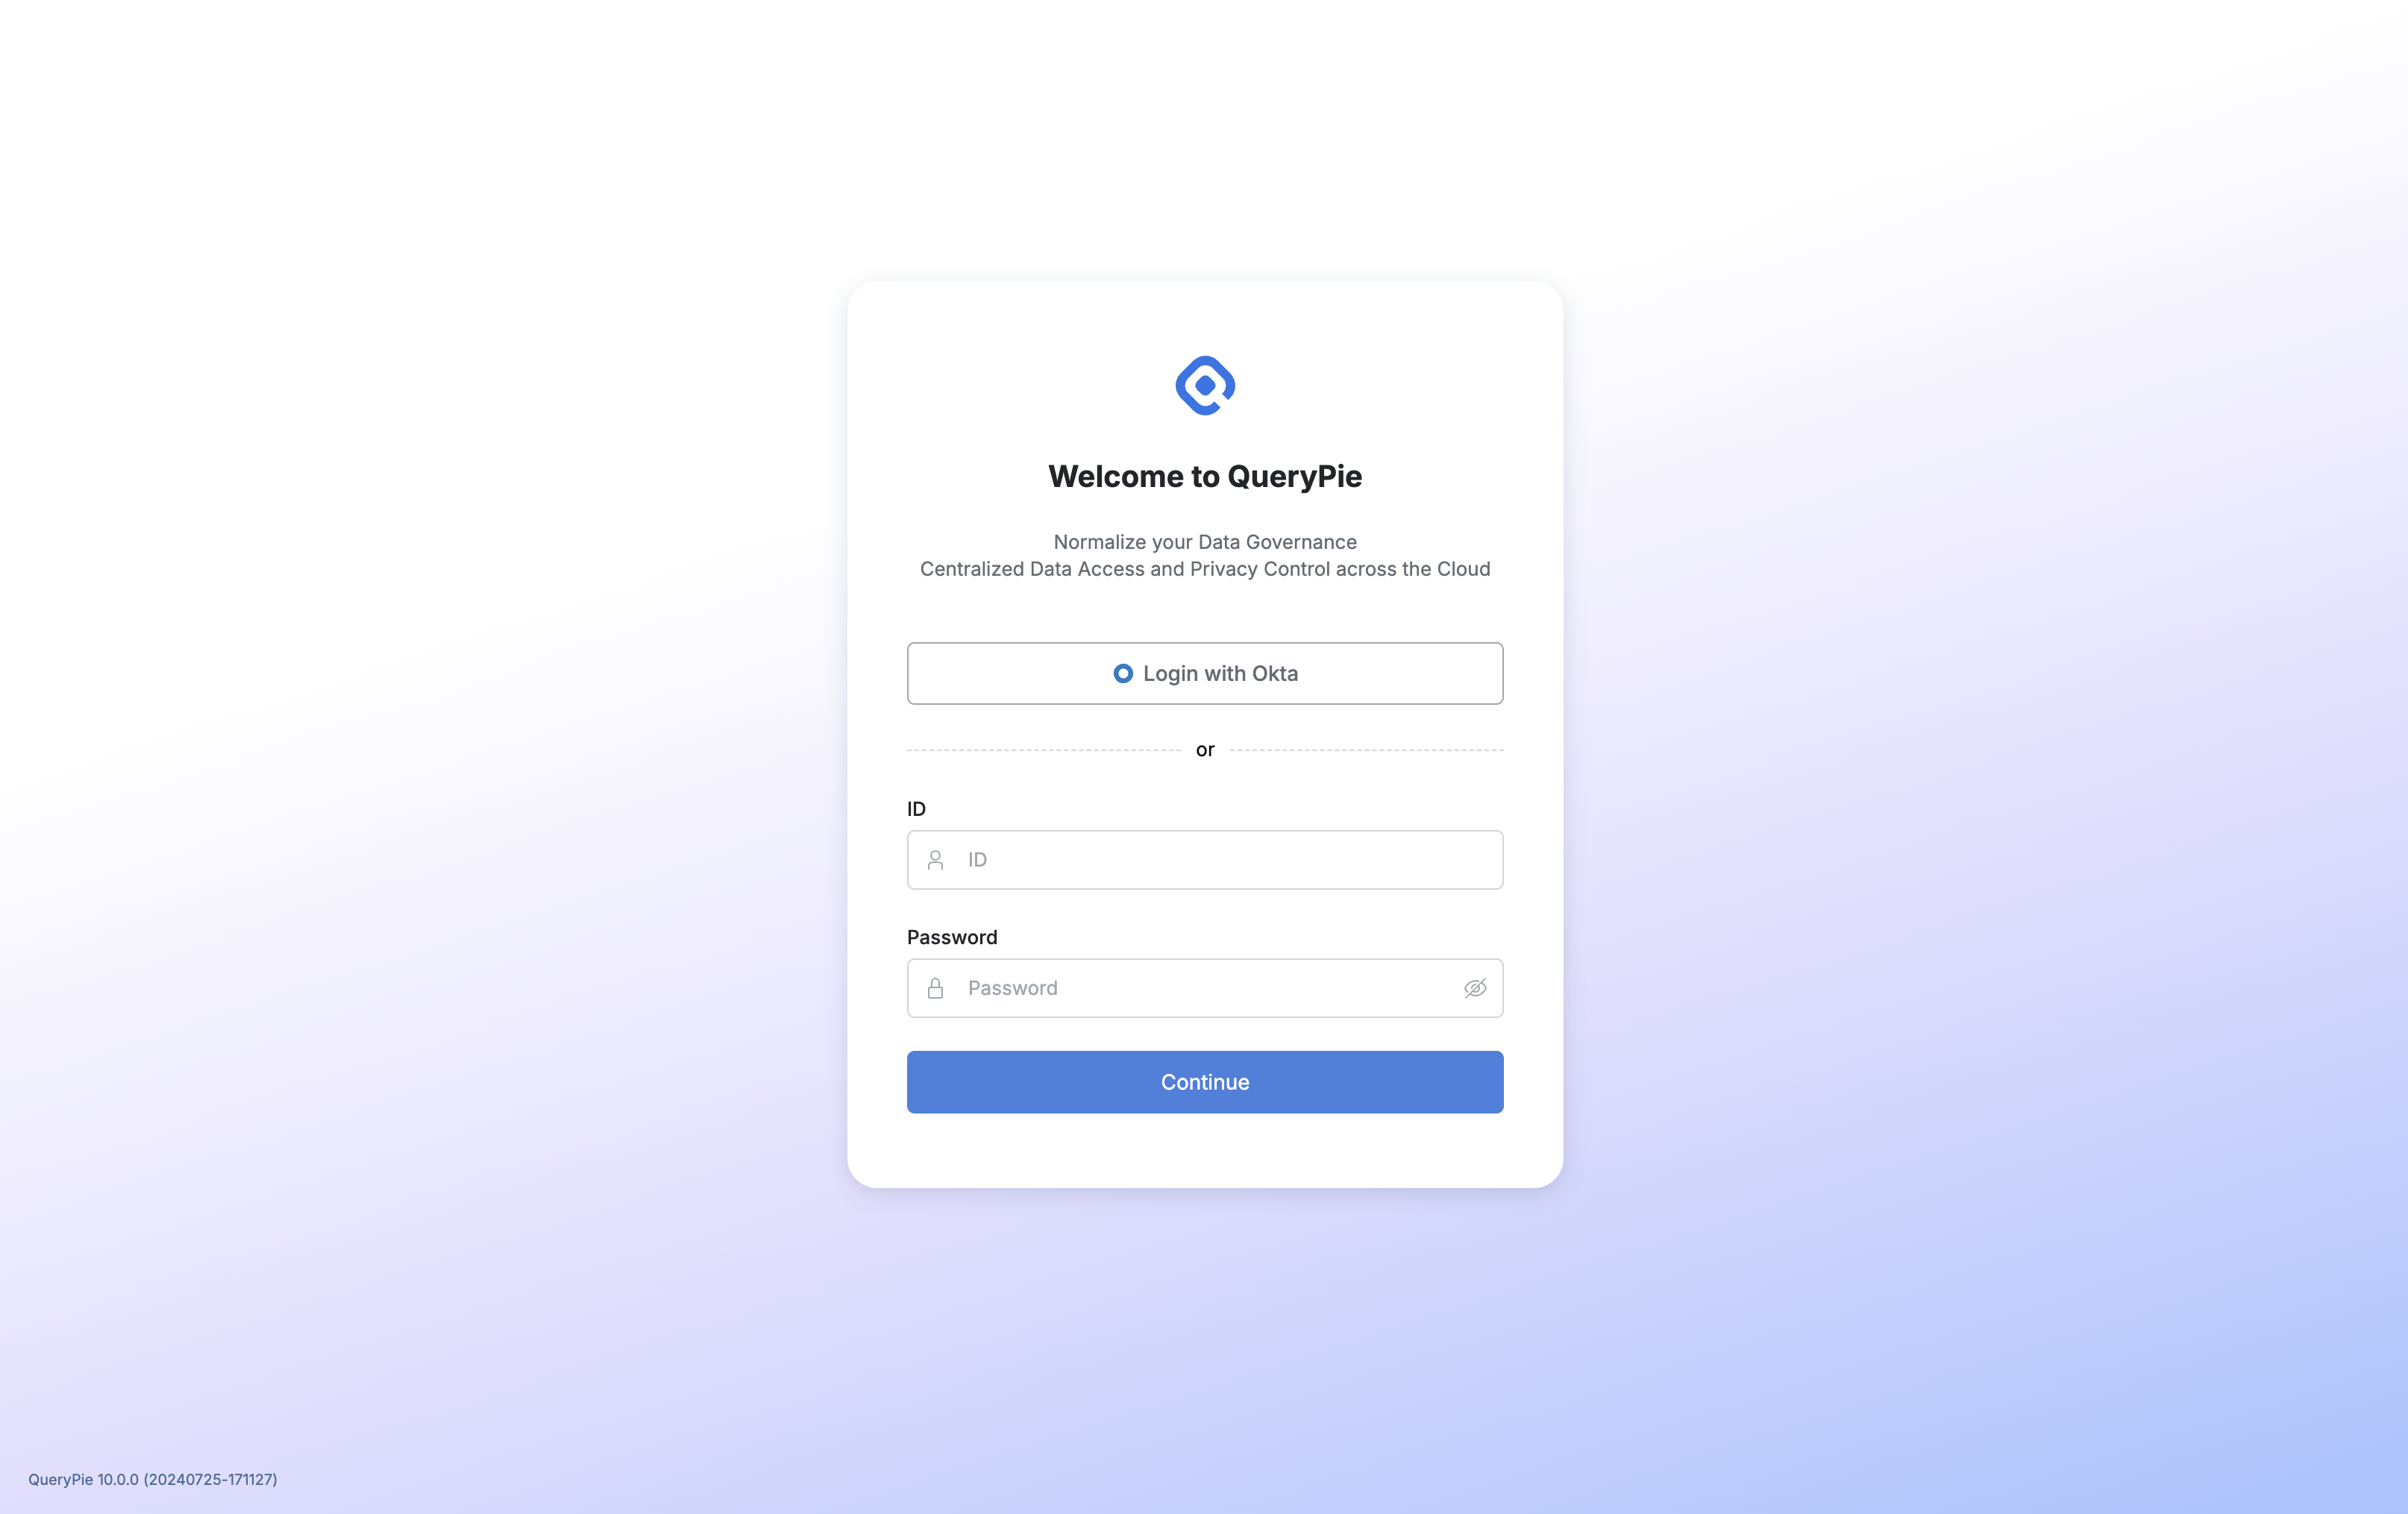
When accessing QueryPie through a web browser, the first screen you encounter is the login page.
If you are accessing from an IP not permitted by the administrator, the login screen may not be visible.

QueryPie Web Login Screen
SSO Login Button: Appears if the administrator has configured SSO (Single Sign-On). Clicking it redirects you to the IdP authentication page.
ID/PW Fields: Enter your registered QueryPie ID and password, then click the
Continuebutton to log in.
User Dashboard
Upon successful login, you will be directed to the user dashboard. The dashboard provides an overview of essential information, such as the roles assigned to the currently logged-in user, their associated groups, approval status, and a list of recent connections.

User > My Dashboard
User Information
Basic Info: Displays the user’s display name, email, and last login time.
Groups: Shows the user groups the user belongs to.
Roles: Lists the roles assigned to the user, categorized by product area.
Workflow Requests
Sent Requests: Shows the number of approval requests you have sent that are currently in progress.
Received Requests: Shows the number of requests you have received that require your approval.
Submit Requests: Clicking this button allows you to create an approval request directly from the dashboard.
Services
Displays the services available based on your current license. Clicking on a service redirects you to its main screen.
Recent Connections
Shows a list of recent connection histories for each QueryPie service.
Accessing the Admin Page
Users assigned the QueryPie administrator role can see the Go to Admin Page button in the top menu bar. Clicking this button opens the admin page in a separate tab.

User > My Dashboard > Top Right Menu