Splunk Integration
Overview
QueryPie offers a feature to send audit logs to external systems through Splunk.
System admin privileges are required to configure the integration.
Recommended Syslog-Splunk Architecture

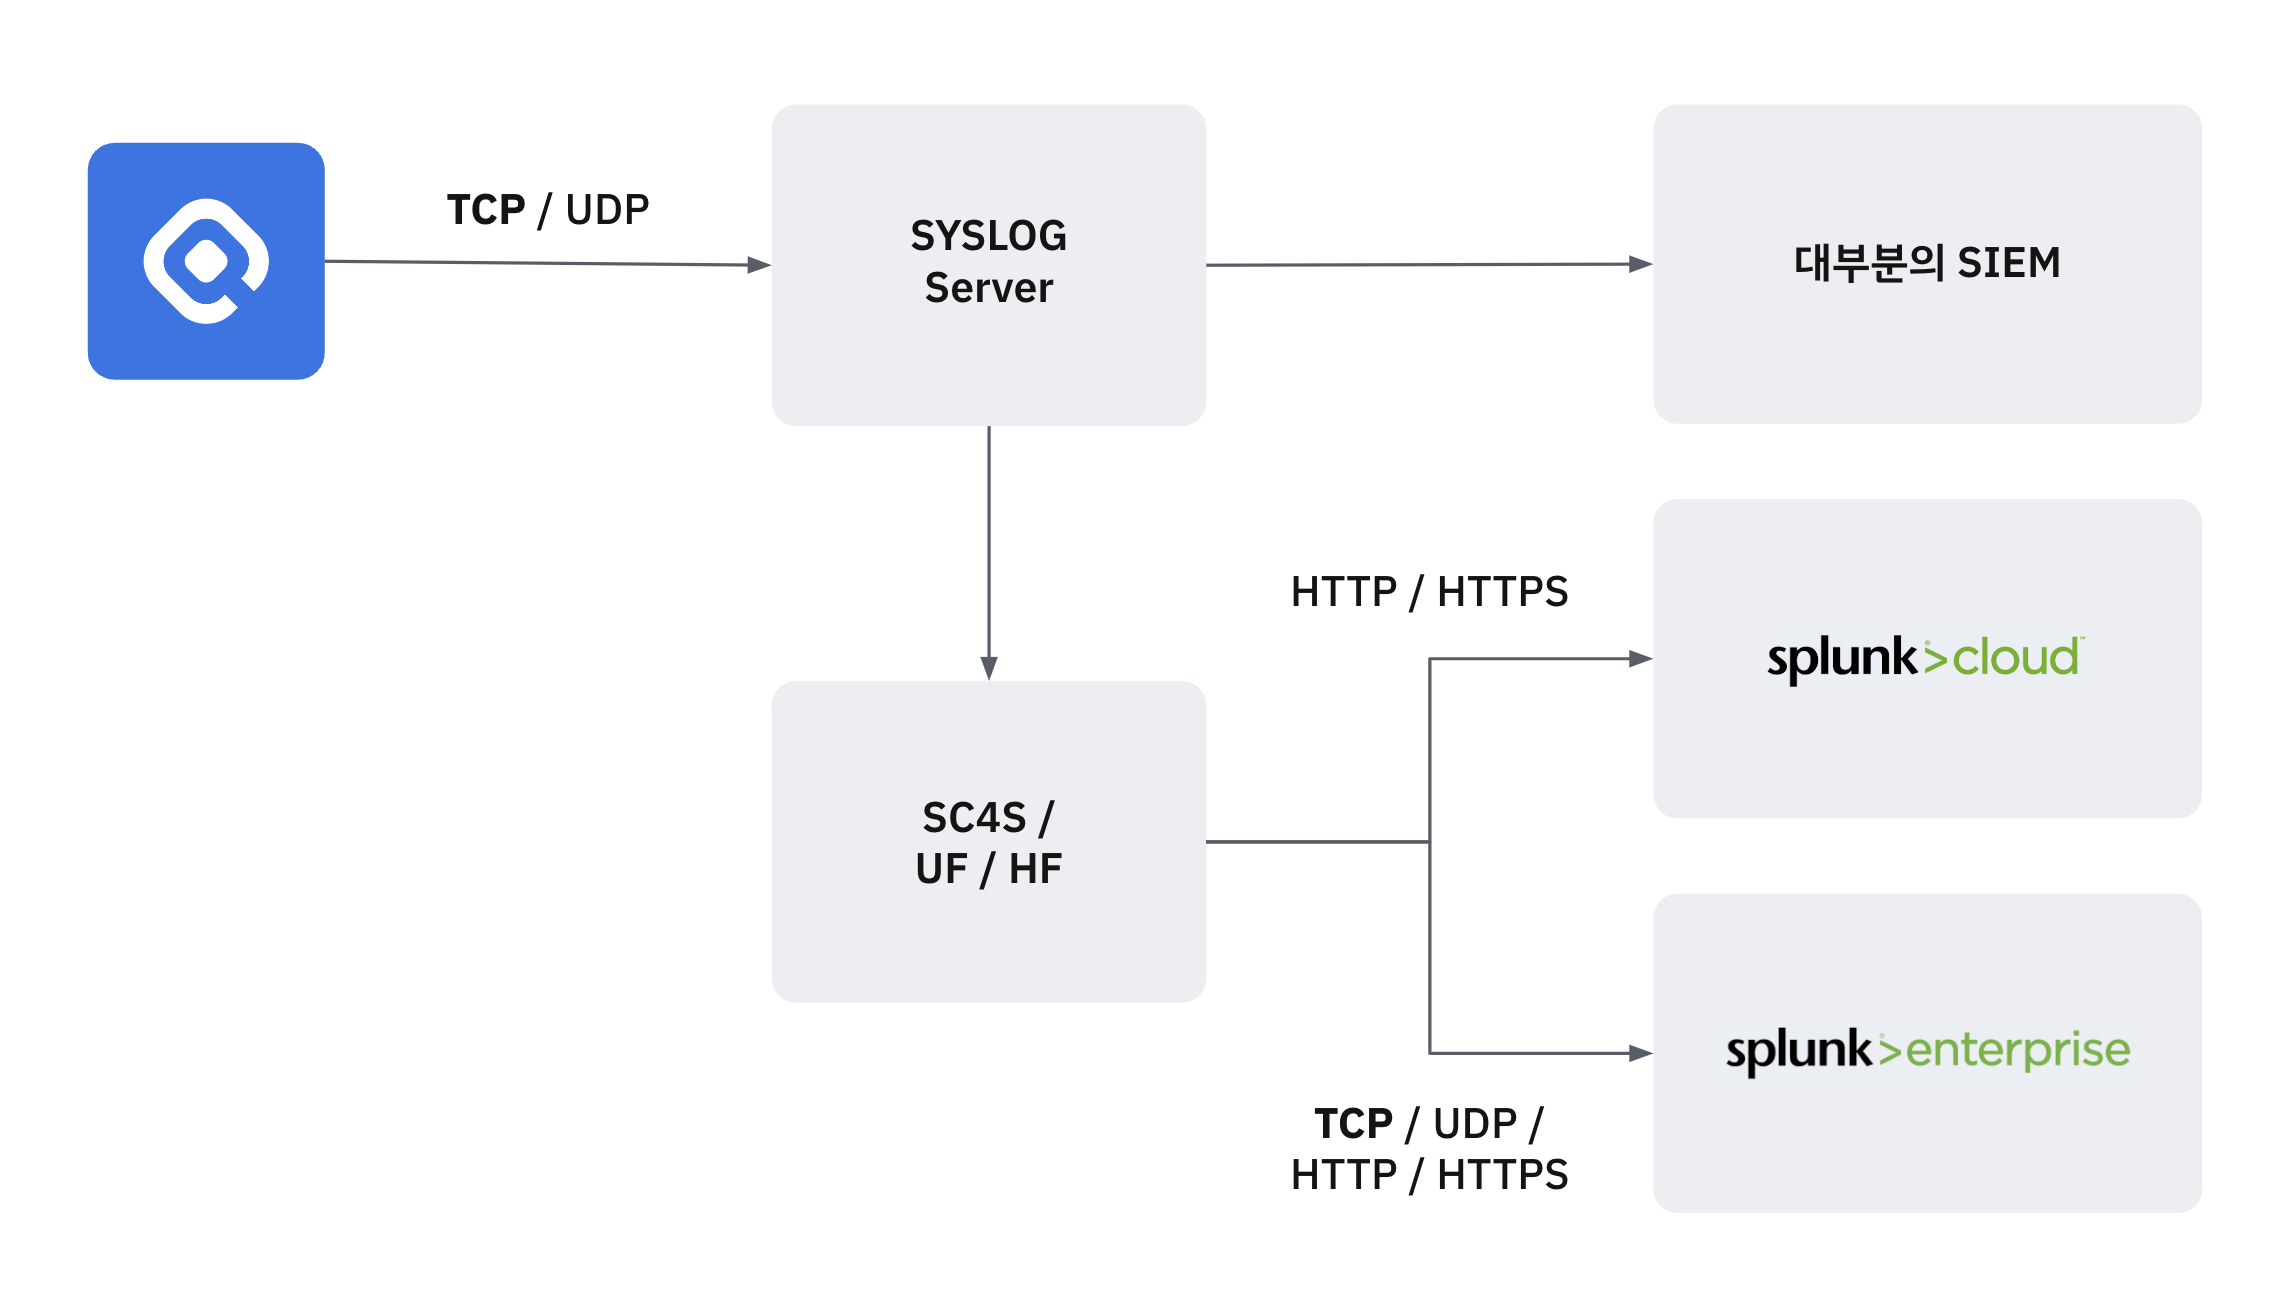
Recommended Architecture for Splunk Integration
The recommended architecture for Syslog-Splunk integration is as follows.
Use a dedicated Syslog server for initial collection before sending the data to Splunk.
Send the data to Splunk using a Universal Forwarder or Heavy Forwarder.
While QueryPie allows direct transmission using TCP, UDP, HTTP, and HTTPS protocols for user convenience, please note that this configuration is not recommended by Splunk.
Splunk also provides a separate SC4S (Splunk Connector for Syslog) for Syslog collection.
Configuring Splunk Integration
Navigate to the Administrator > General > System > Integrations menu.
Click on the
Splunktile to access the detailed configuration page.Click the
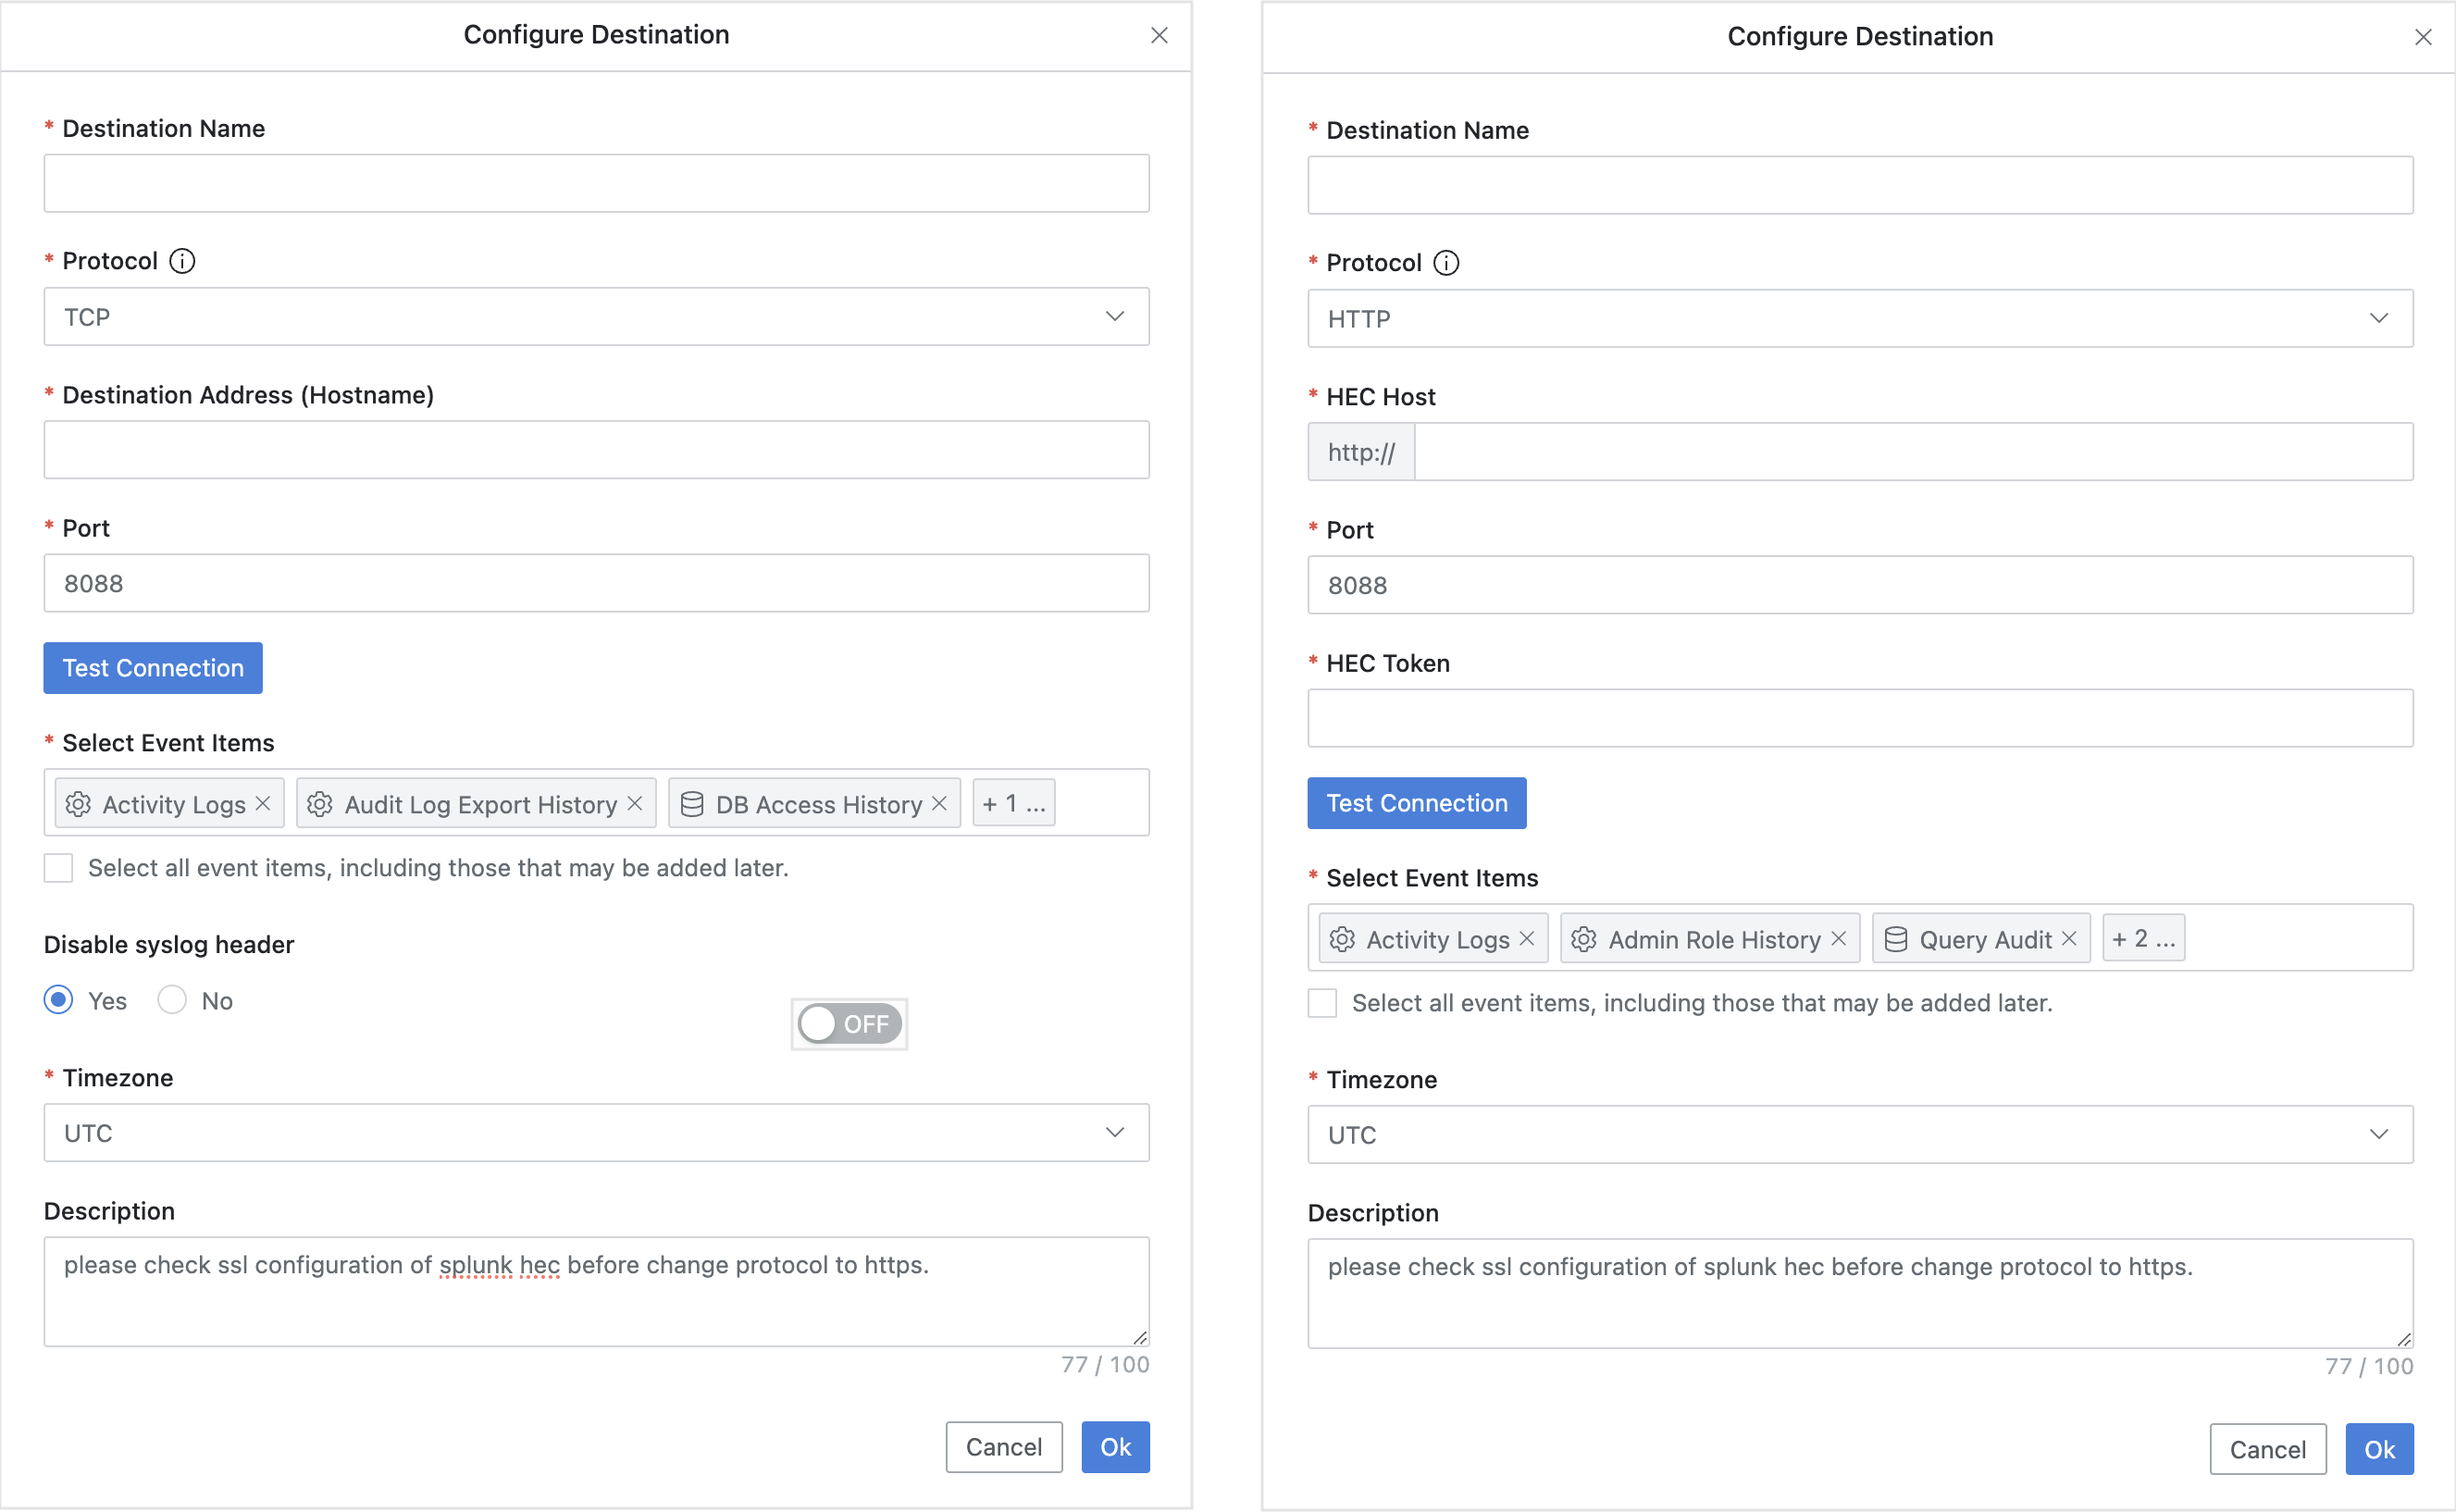
Configurebutton to open a popup where you can enter Destination information.

(Left) TCP/UDP Configuration Screen (Right) HTTP/HTTPS Configuration Screen
Input the following details to create Destination information.
Destination Name : Enter a suitable name to identify the Syslog recipient.
Protocol : Choose from TCP (default), UDP, HTTP, or HTTPS for sending data to Splunk.
UDP has packet length limitations and is less secure, so TCP is recommended.
When using the HTTP Event Collector (HEC) in Splunk, the default is HTTPS.
If you need to use HTTP instead of HTTPS, you must first disable the SSL option in Splunk’s HEC settings. When selecting HTTP, you will also need to enter the following field values:
HEC Host : Enter the hostname or IP address of the Splunk server.
HEC Token : Enter the Splunk HEC token value.
Destination Address (Hostname): Enter the IP address or hostname of the Splunk server or forwarder. For HTTP/HTTPS protocols, this field will be replaced by the HEC Host input.
Port : Specify the listening port of the Syslog server (The default is 514 for TCP/UDP).
Before entering the Splunk HEC port number, check the settings in Splunk.
If HTTP/HTTPS protocol is selected in the Splunk menu:
Enter the port number configured in the global options of the Splunk HTTP Event Collector. The default port is 8088.
For Splunk Cloud users, enter 443.
HEC Token : For HTTP and HTTPS protocols, you need to input the token value generated during the Splunk HEC setup.
Test Connection : For TCP, HTTP, and HTTPS protocols, you can test the communication status with the target.
Due to the nature of the UDP protocol, the communication status check is not possible, so the button will be disabled.
Select Event Items : You can selectively choose which event items to send. If you select the checkbox Select all event items, including those that may be added later, all available events will be sent.
Disable syslog header : This option allows you to send logs without the syslog header information (default is Yes). This option is useful if some SIEMs have difficulties parsing JSON with the syslog header. Note that for HTTP and HTTPS protocols, this option is unavailable, and logs are always sent without the syslog header.
Description : Enter a brief description of the configuration (up to 100 characters).
Click the
OKbutton to save them.The Syslog transmission does not start immediately after saving.
To start sending logs, toggle the:토글:switch at the top left of the page to the active position.
This toggle button can also be used to temporarily stop the transmission for maintenance or other purposes.
If you no longer need to send Syslog logs, you can delete the configuration using the
Deletebutton.However, you must first deactivate the toggle before deletion. :토글off:
Notes
Depending on your license, the available event items that QueryPie sends via Syslog may vary.
Event Item | DAC | SAC | KAC |
|---|---|---|---|
User Access History | O | O | O |
Activity Logs | O | O | O |
Admin Role History | O | O | O |
Audit Log Export | O | O | O |
DB Access History | O | N/A | N/A |
Query Audit | O | N/A | N/A |
DML Snapshot | O | N/A | N/A |
DB Access Control Logs | O | N/A | N/A |
Account Lock History | O | N/A | N/A |
Server Access History | N/A | O | N/A |
Server Command Audit | N/A | O | N/A |
Server Session Logs | N/A | O | N/A |
Server Access Control Logs | N/A | O | N/A |
Workflow Logs | O | O | O |
Approval Urgent Waiting Logs | O | O | O |
Request Audit | N/A | N/A | O |
Kubernetes Role History | N/A | N/A | O |
Pod Session Recordings are not supported for Syslog transmission because their entries overlap with the pods/exec resource call history in the Request Audit.
%201.png)