Command Audit
Overview
Command Audit records the commands executed on servers accessed through QueryPie. For Windows Servers, it logs mouse clicks, keyboard inputs, and process names.
Viewing Command Audit

Administrator > Audit > Servers > Command Audit
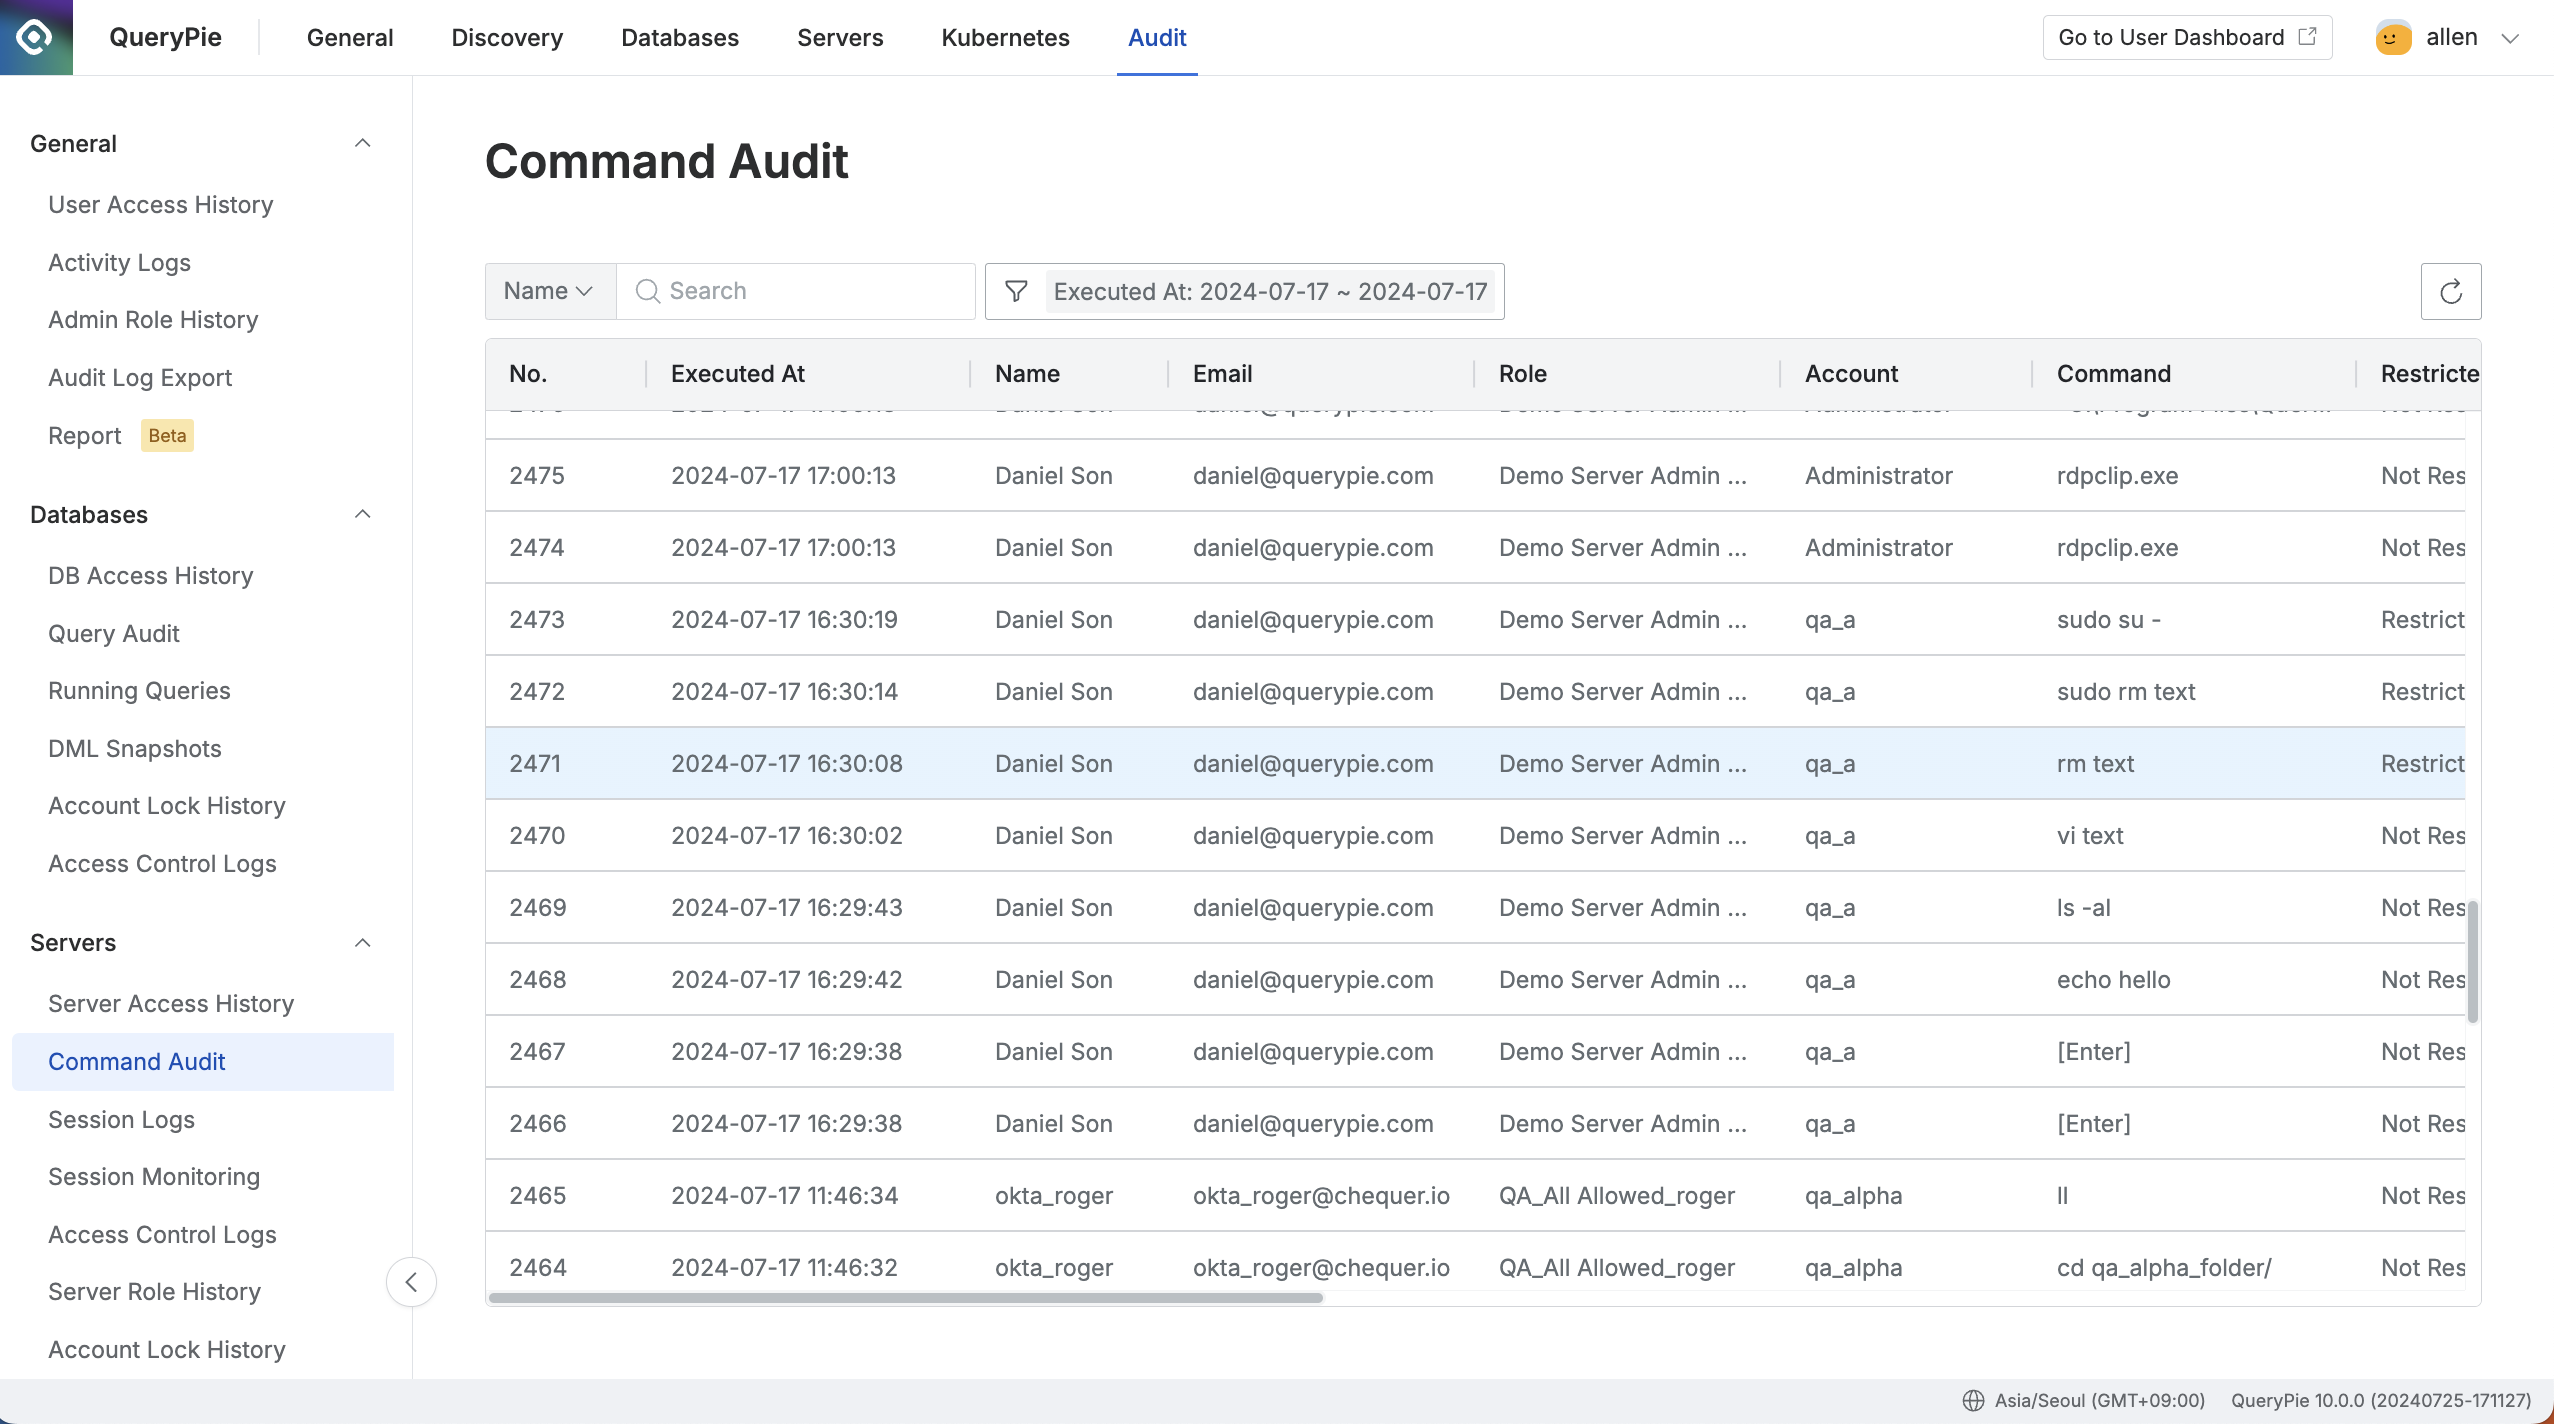
Navigate to the Administrator > Audit > Servers > Command Audit menu.
Logs are displayed in descending order based on the connection date.
You can search the logs using the search bar at the top left of the table by the following criteria:
Name: User's name
Server Name: Name of the accessed server
Command: Executed command
Role: Role used during access
Click the filter button to the right of the search field to filter logs using AND/OR conditions with the following options:

Server OS: Operating system of the accessed server
Protocol: Protocol used during access
Executed From: Method of connection
web: Access via QueryPie Web
proxy: Access via Agent or Seamless SSH Connection
Action Type: Type of recorded event
All: All types
File Download: (SFTP) File download
File Upload: (SFTP) File upload
Process Start: (RDP) Process start
Process Stop: (RDP) Process stop
User Input - MouseClick: (RDP) User mouse click
User Input - MouseDoubleClick: (RDP) User mouse double-click
User Input - KeyPress: (RDP) User keyboard input
Executed At: Time of command execution
Restricted: Whether the command was blocked
Click the refresh button at the top right of the table to update the log list.
The table provides the following column information:
No: Event identification number
Executed At: Time of command execution
Name: User's name
Email: User's email
Role: Role used during access
Account: Server access account
Command: Executed command
Restricted: Whether the command was blocked
Not Restricted
Restricted
Restricted Command: The blocked command
Server Name: Name of the accessed server
Server OS: Operating system of the accessed server
Host: Host of the accessed server
Port: Port used during access
Protocol: Protocol used during access
Client IP: User's client IP address
Client Name: User's connection method
Action Type: Type of recorded event
Message: Any additional notes or error messages
Viewing Command Audit Details
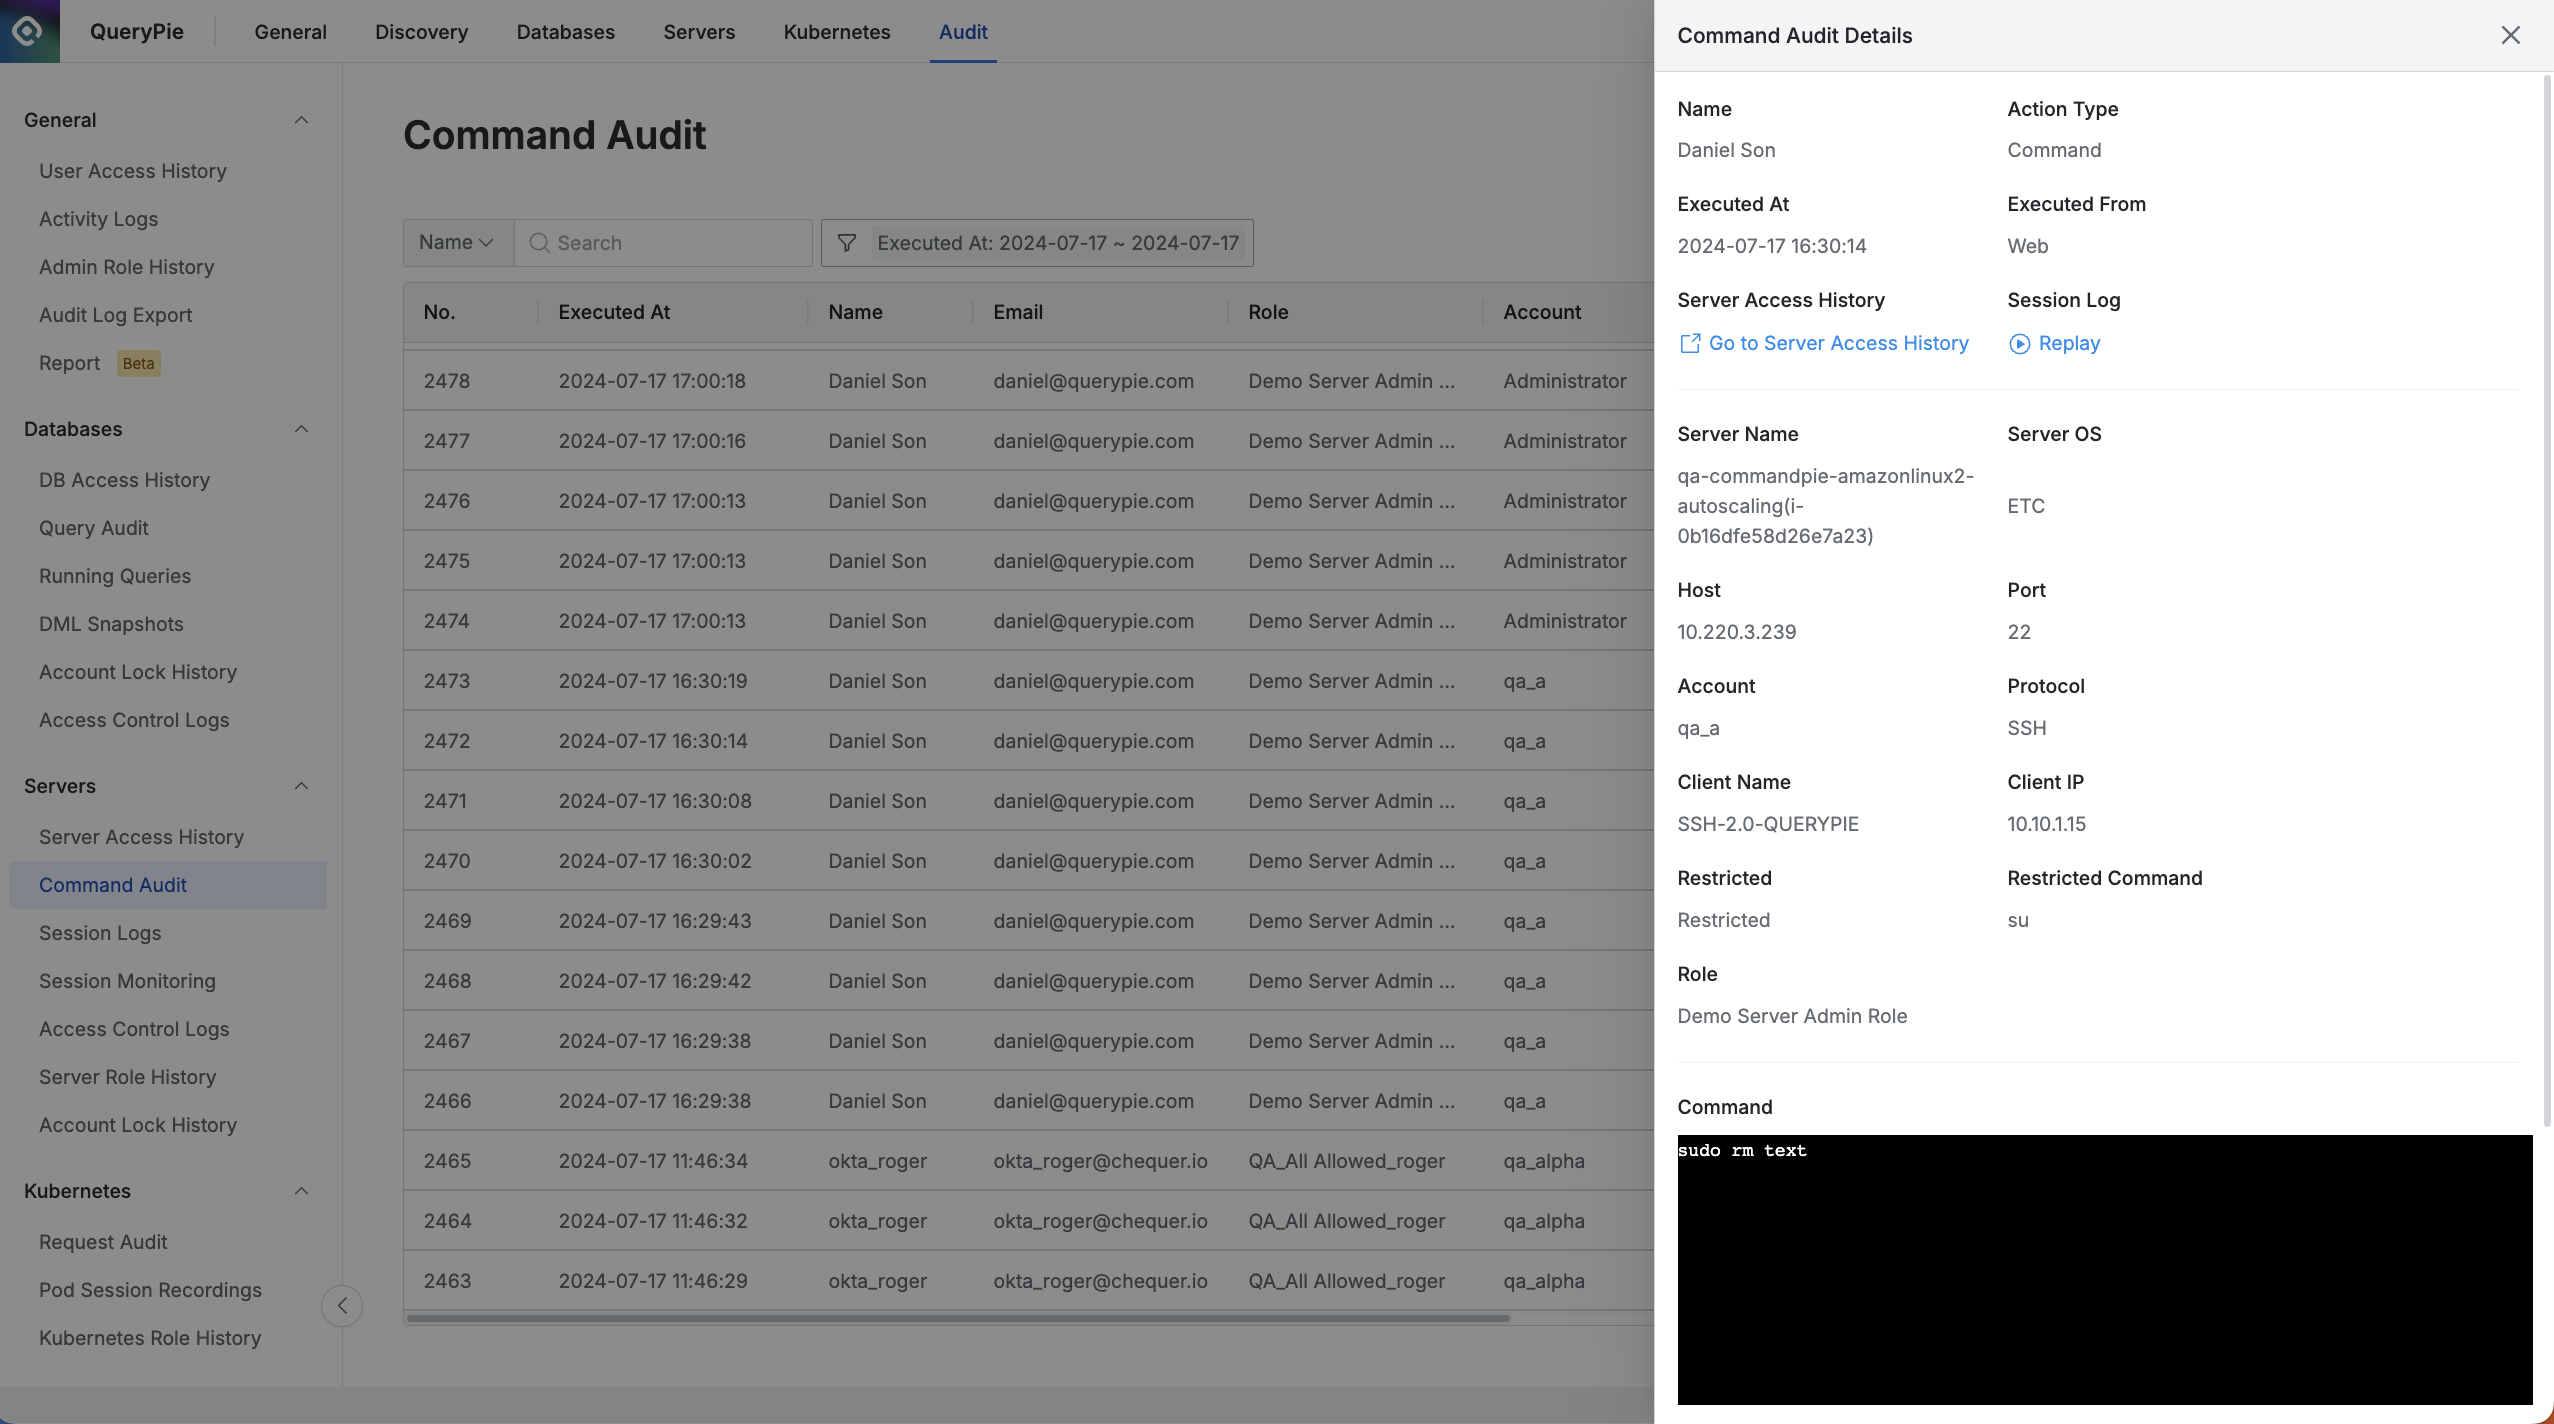
To view detailed information about a specific command, click on a row in the table to open the details.

Administrator > Audit > Servers > Command Audit > Command Audit Details
The drawer on the right side will display the following information:
Name: User's name
Action Type: Type of recorded event
Executed At: Time of command execution
Executed From: Method of connection
Server Access History: Access logs for the session
Session Log: Session recording of the command execution
Server Name: Name of the accessed server
Server OS: Operating system of the accessed server
Host: Host of the accessed server
Port: Port used during access
Account: Server access account
Protocol: Protocol used during access
Client Name: User's connection method
Client IP: User's client IP address
Restricted: Whether the command was blocked
Restricted Command: The blocked command
Command: User-input command (for RDP, it could be the process name or click coordinates)
Result: Outcome of the command execution