Query Audit
Overview
QueryPie records the history of executed queries and actions performed on the database.
Viewing Query Audit

Administrator > Audit > Databases > Query Audit
Navigate to the Administrator > Audit > Databases > Query Audit menu.
Logs are displayed in descending order based on the execution date.
You can search the logs using the search bar at the top left of the table with the following criteria:
Name: User's name
Table(s): Name of the table(s) involved
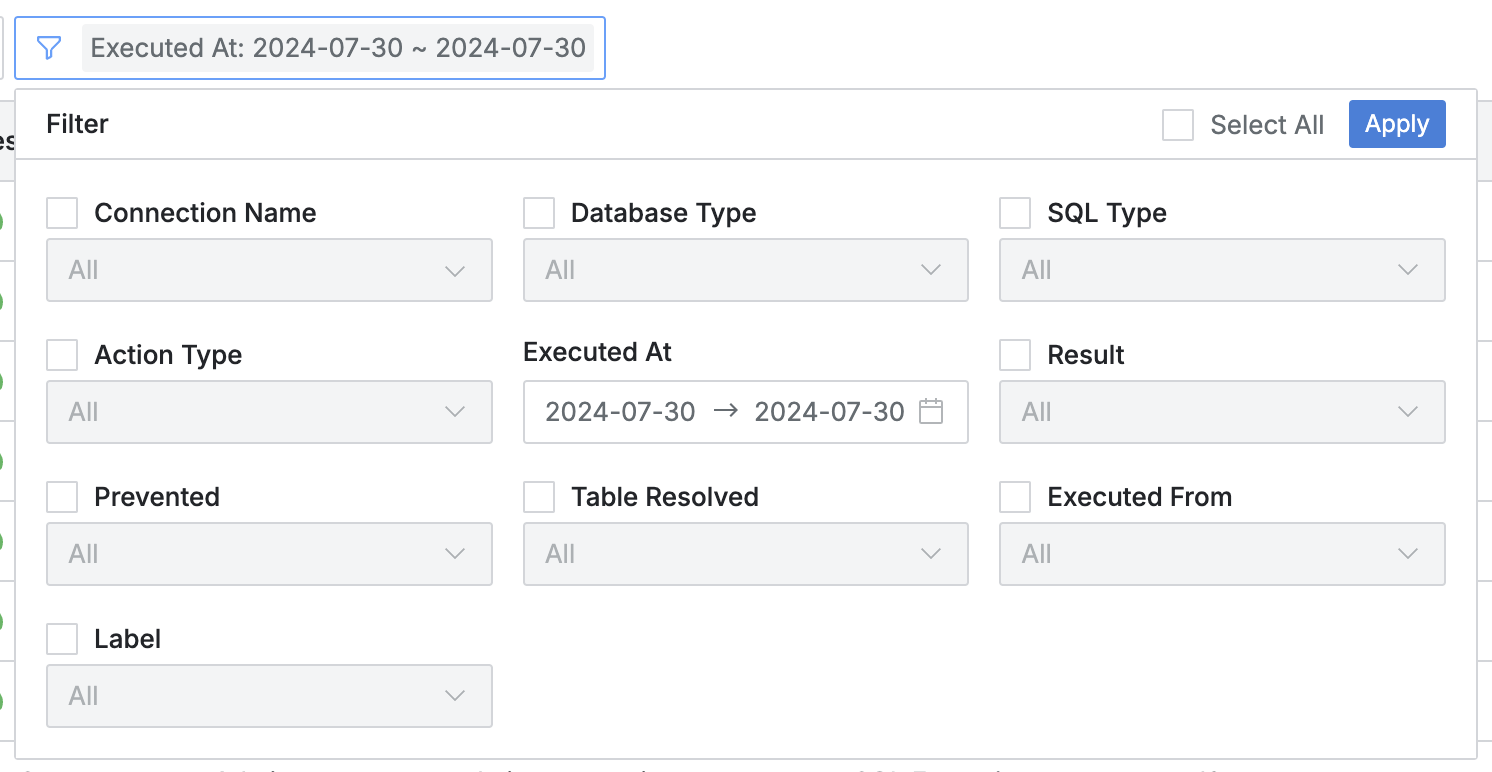
Click the filter button to the right of the search field to filter logs using AND/OR conditions with the following options:

Connection Name: Name of the DB connection
Database Type: Type of the database
SQL Type: Type of SQL statement
Action Type: Type of action
SQL Execution: Executing an SQL statement
Export Data: Exporting data
Export Schema: Exporting schema
Import Data: Importing data
Import Schema: Importing schema
Copy Clipboard: Copying to clipboard
Executed At: Date and time of execution
Result: Success or failure of the task
Prevented: Whether the access was blocked by a policy
Table Resolved: Whether the table was involved
Executed From: Source of the query execution
Web Editor: Executed from the QueryPie web editor
Proxy: Executed through QueryPie proxy
SQL Request: Executed through the SQL Request workflow
SQL Job: Executed by an SQL Job
SQL Export Request: Executed through the SQL Export Request workflow
Label: Whether it is a DB ledger
Click the refresh button at the top right of the table to update the log list.
The table provides the following column information:
No: Event identification number
Executed At: Date and time of execution
Result: Success or failure of the task
Name: User's name
Email: User's email
Action Type: Type of action
Connection Name: Name of the DB connection
Database Type: Type of the database
Privilege Name: User's access privilege
Client IP: User's client IP address
Replication Type: Type of DB replication
DB Host: Connected DB host
DB Name: Name of the database
DB User: DB user ID
Table(s): Name of the table(s) involved
SQL Type: Type of SQL statement
Query: Executed query statement
Time(ms): Execution time in milliseconds
Rows: Number of rows affected
Data Size: Size of the data affected
Client Name: Name of the client used (e.g., DataGrip)
Error Message: Records of execution failures or other issues
Execution Reason: Reason for executing the query
Prevented: Whether the access was blocked by a policy
Label: Whether it is a DB ledger
Executed From: Source of the query execution
Viewing Query Audit Details
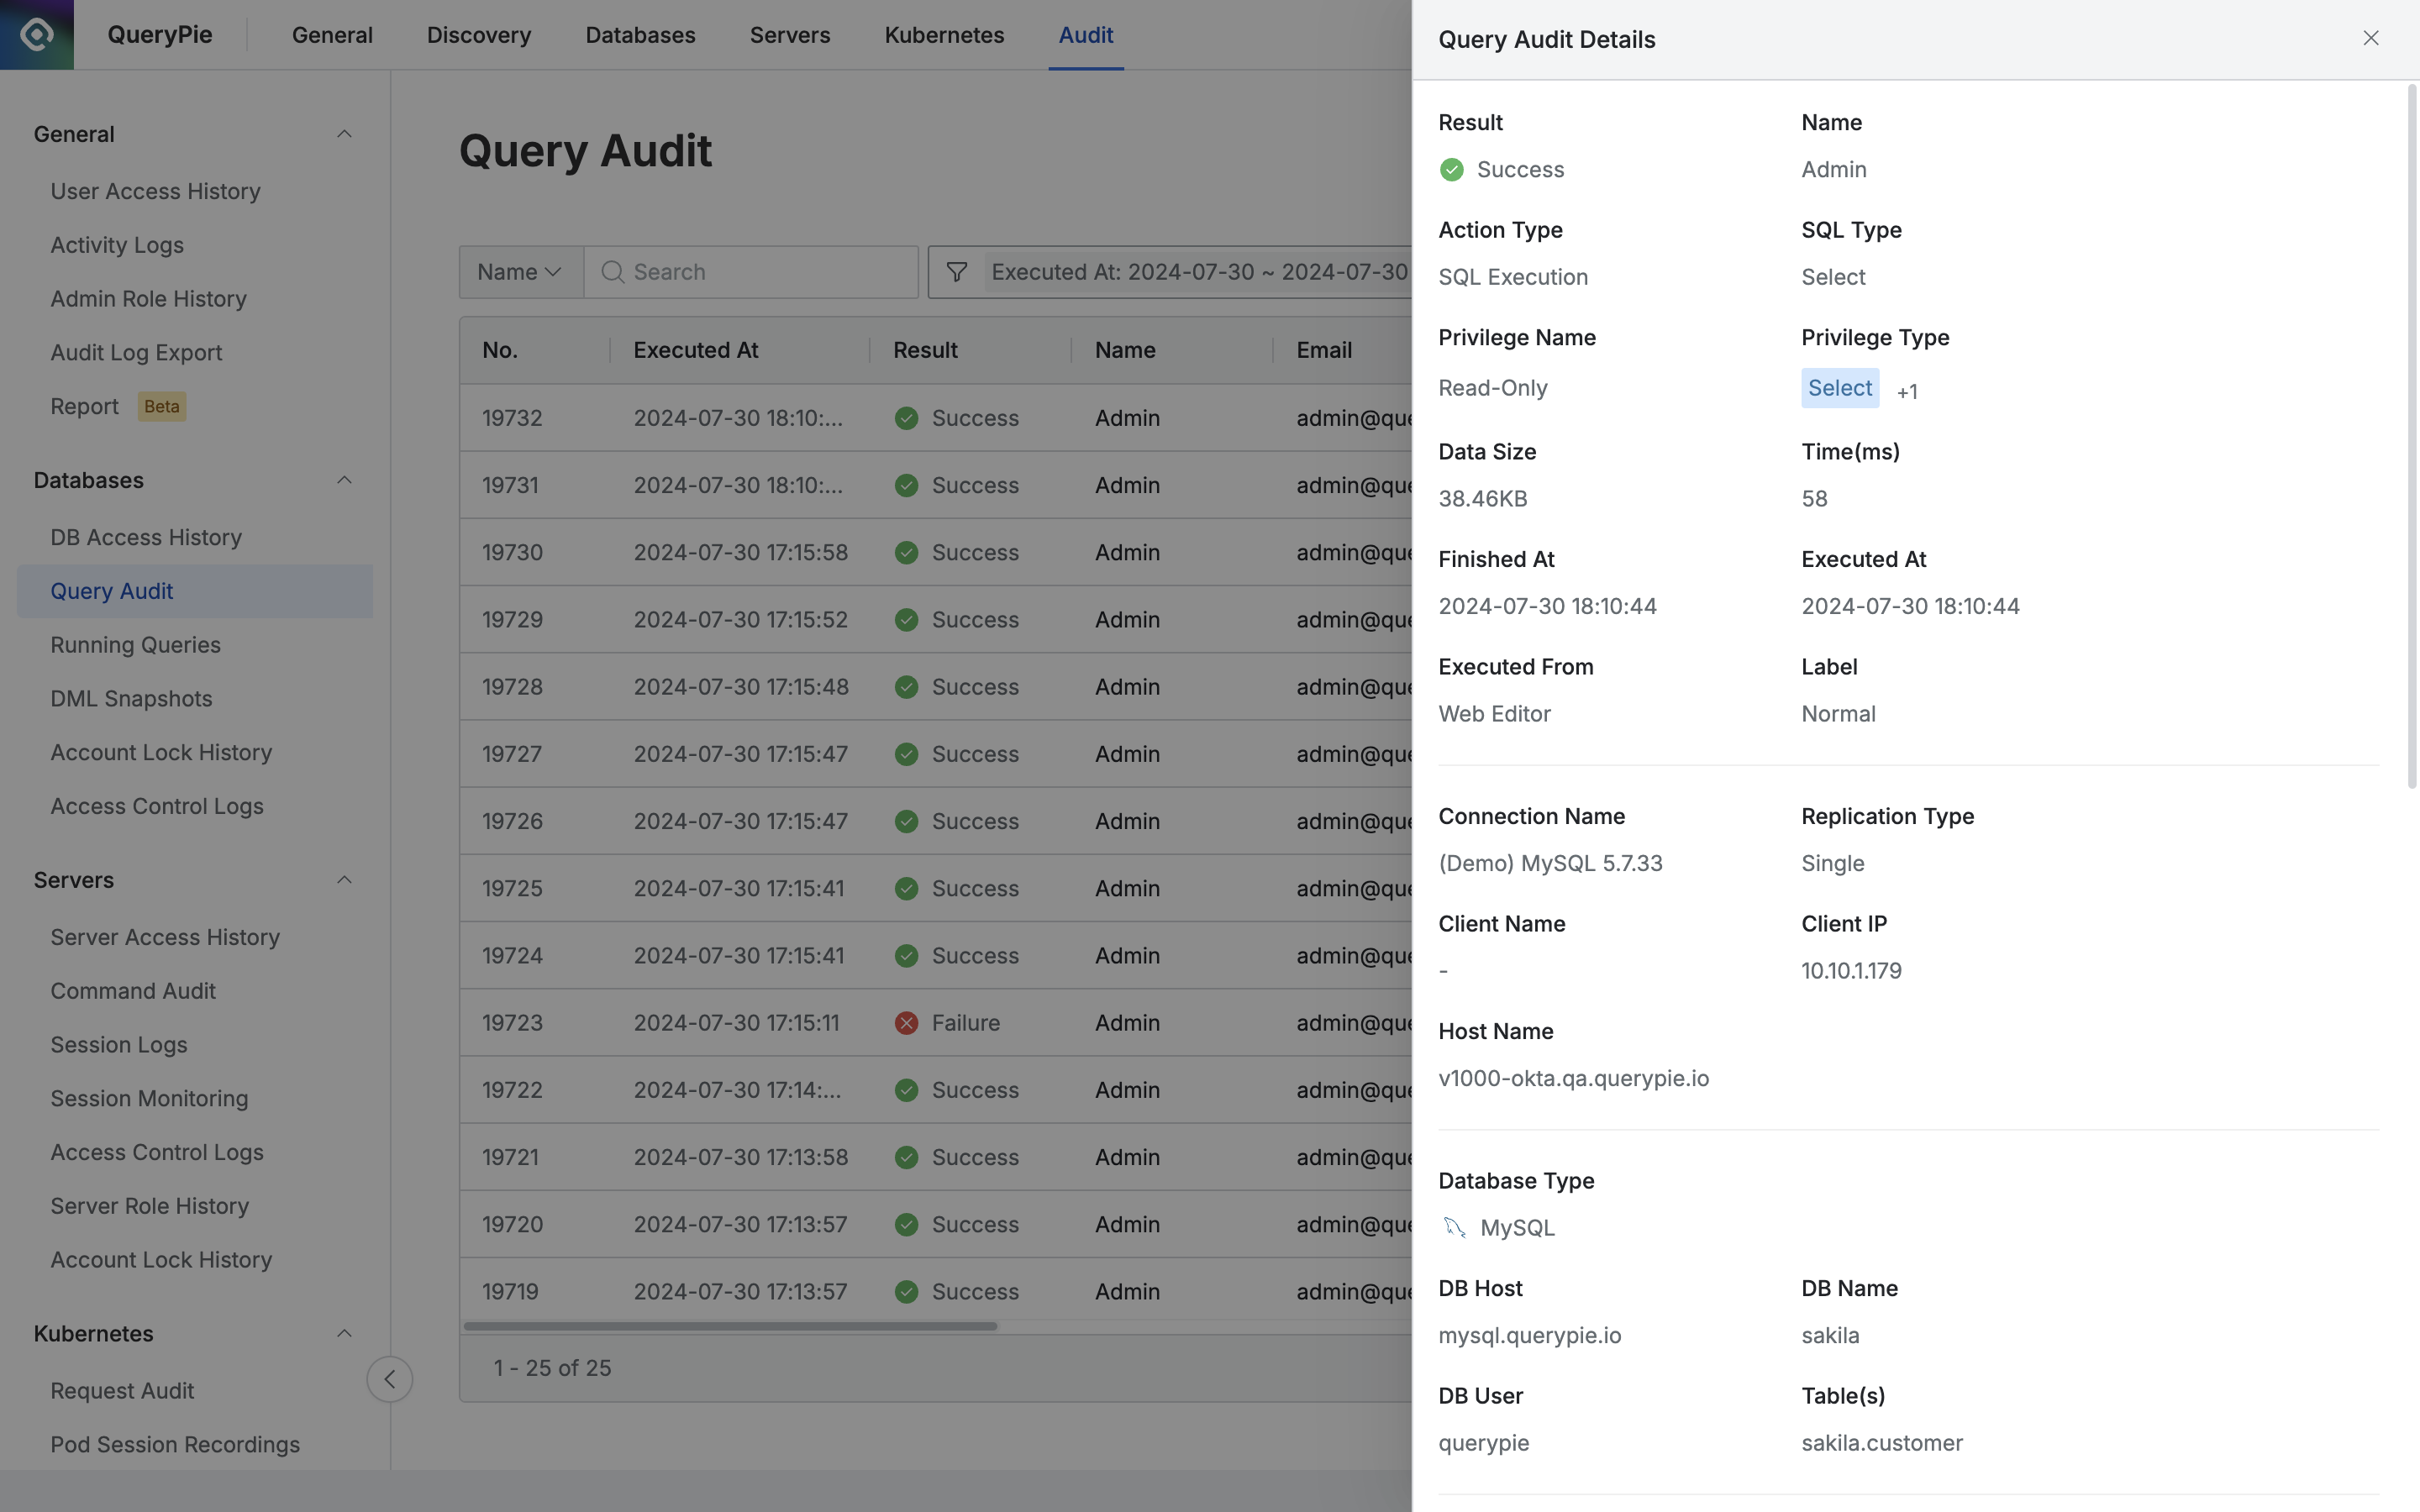
Click on any row to view detailed information about the query.

Administrator > Audit > Databases > Query Audit > Query Audit Details
The drawer on the right displays the following basic query audit information:
Result: Success or failure of the task
Name: User's name
Action Type: Type of action
SQL Type: Type of SQL statement
Privilege Name: User's access privilege
Privilege Type: Type of user access privilege
Data Size: Size of the data affected
Time(ms): Execution time in milliseconds
Executed At: Date and time of execution
Executed From: Source of the query execution
Label: Whether it is a DB ledger
Connection Name: Name of the DB connection
Replication Type: Type of DB replication
Client Name: Name of the client used (e.g., DataGrip)
Client IP: User's client IP address
Host Name: Name of the host executing the connection
Database Type: Type of the database
DB Host: Connected DB host
DB Name: Name of the database
DB User: DB user ID
Table(s): Name of the table(s) involved
At the bottom, the executed query statement and additional details are displayed:
Query: Executed query statement
First 10 Rows: Sample of the first 10 rows of the executed SELECT statement
This field is displayed only if the Display the first 10 rows in Query Audit setting is enabled (default: Off).
Refer to DB Connection Security Settings under Security.
Copy Data: Button to copy pre/post data
Error Message: Records of execution failures or other issues
Execution Reason: Reason for executing the query
%201.png)