Dashboard
Overview
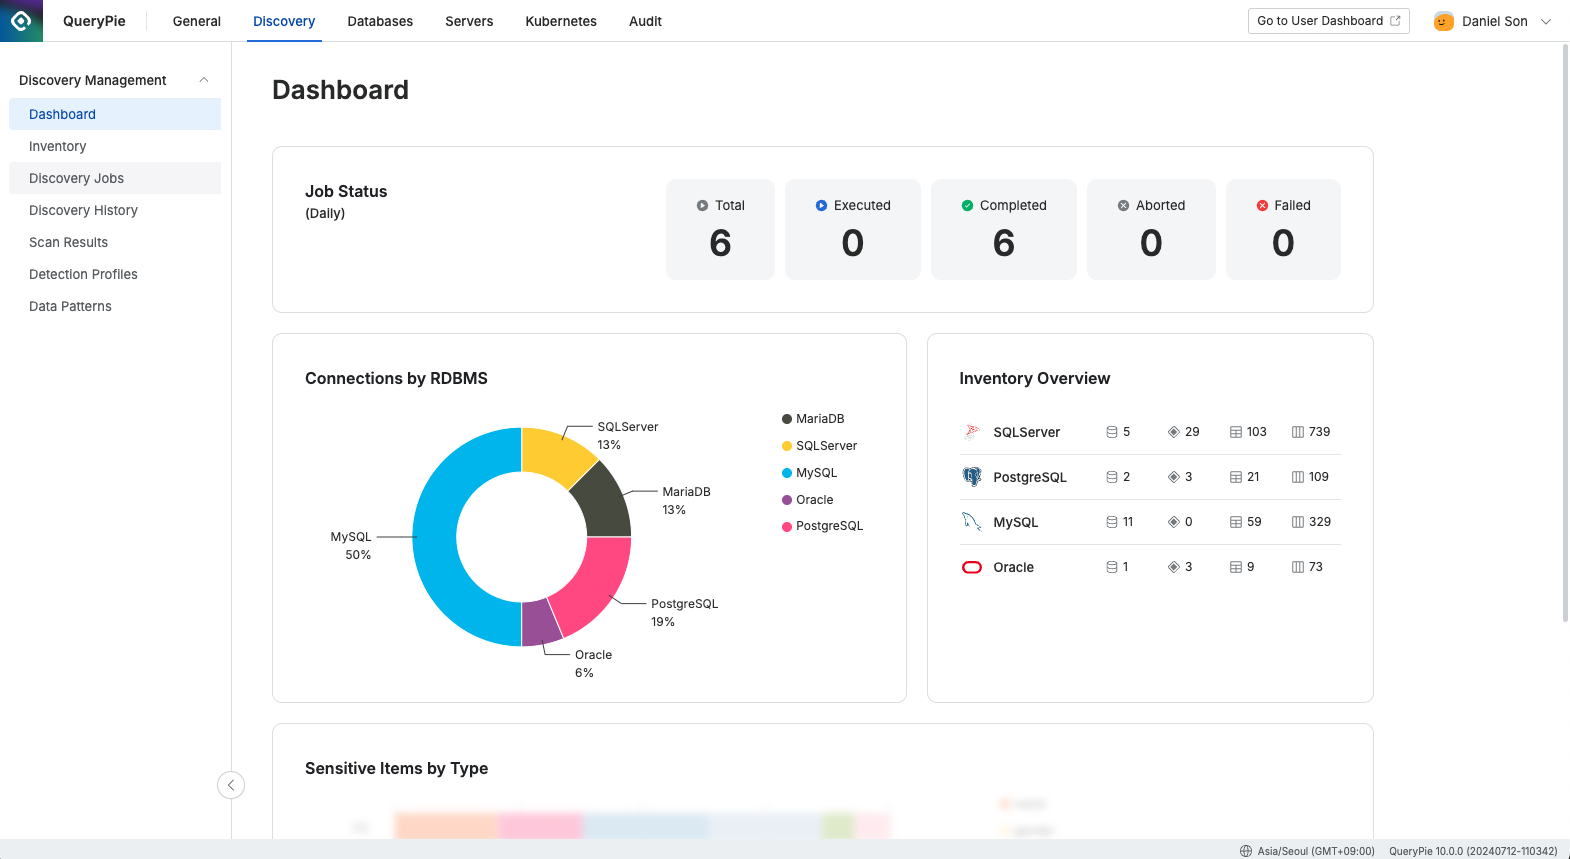
The results of Data Discovery can be reviewed through visual representations (widgets). For data to be displayed in each widget, at least one Discovery job must have been successfully executed.

Administrator > Discovery > Discovery Management > Dashboard
Widgets
Job Status : Displays daily statistics on the overall status of Discovery jobs. The values reset to zero at 00:00 and are recalculated.
Total : The total number of Discovery jobs between 00:00 and 23:59:59.
Executed : The number of Discovery jobs currently in progress.
Completed : The total number of Discovery jobs successfully completed between 00:00 and 23:59:59.
Aborted : The total number of Discovery jobs that were forcibly stopped by the user between 00:00 and 23:59:59.
Failed : The total number of Discovery jobs that failed between 00:00 and 23:59:59.

Job Status Widget
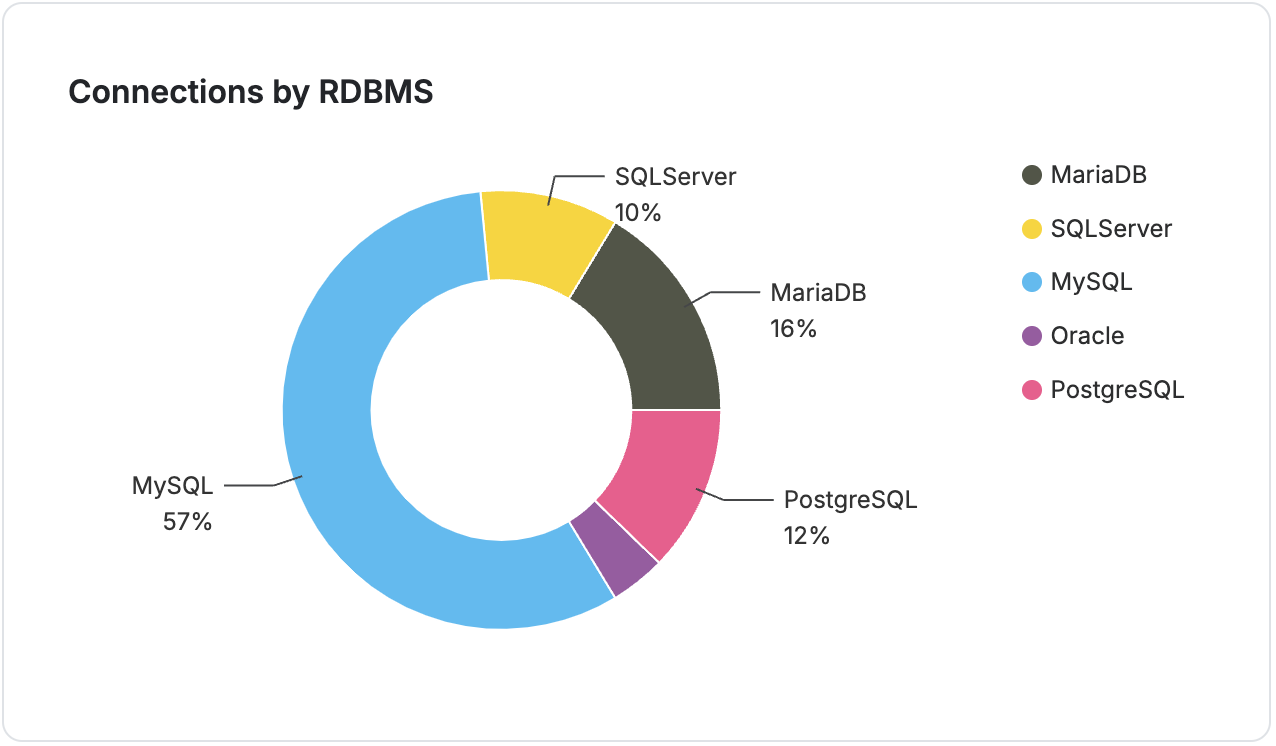
Connections by RDBMS : A pie chart representing the distribution of connection types used in Data Discovery scans. (Supported databases include MySQL, MariaDB, Oracle, PostgreSQL, MS SQL Server, and Azure SQL.)
* Limitation: If the percentage of a particular item is less than 10%, the label and guideline for that item will not be displayed on the chart.
Connections by RDBMS Widget
Inventory Overview : After at least one successful job execution, this widget stores information about the database structure and displays the aggregate information for each structure. Databases with schemas count the schemas.

Inventory Overview Widget
Sensitive Items by Type : A bar chart that shows the percentage of discovered sensitive information by type.

Sensitive Items by Type Widget
%201.png)