Command Audit
Overview
Records commands executed on servers accessed through QueryPie. For Windows Servers, it records mouse clicks, keyboard inputs, and executed process names.
Viewing Command Audit
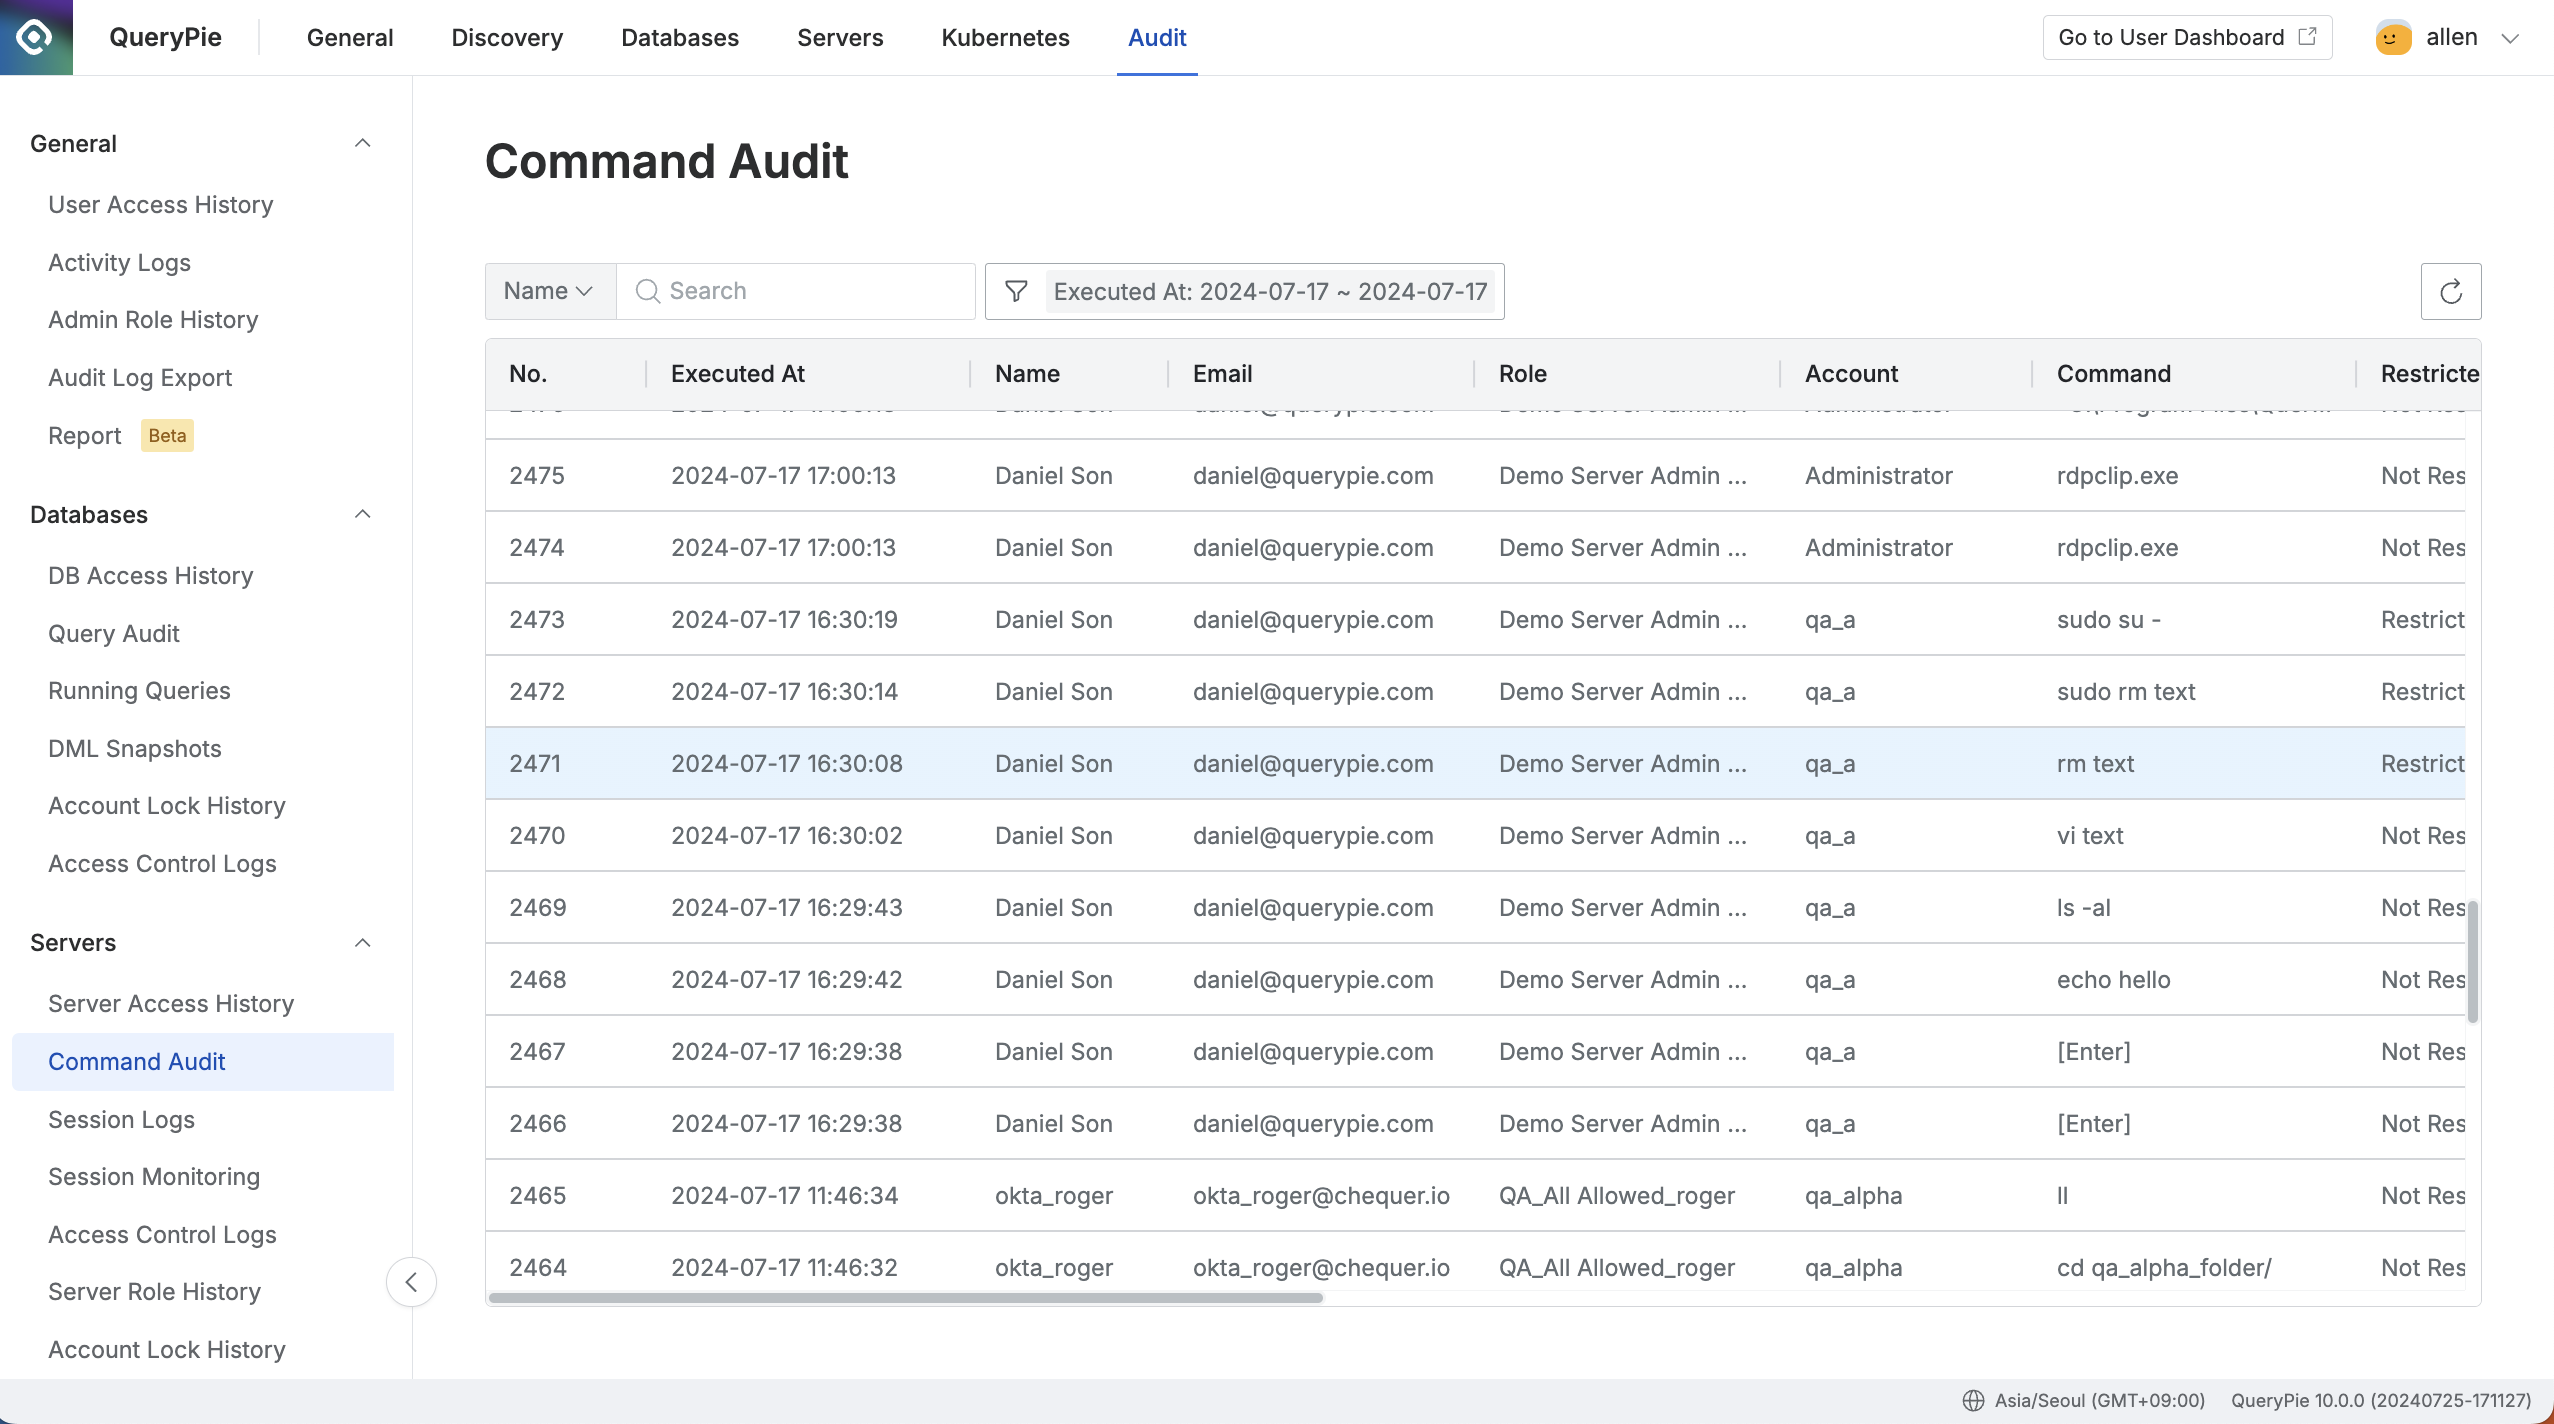
Administrator > Audit > Servers > Command Audit
- Navigate to the Administrator > Audit > Servers > Command Audit menu.
- Logs are displayed in descending order based on the connection date.
- You can search with the following conditions through the search field in the top left of the table:
- Name : User name
- Server Name : Connected server name
- Command : Executed command
- Role : Connection role
- Click the filter button on the right side of the search field to filter with AND/OR conditions for the following:
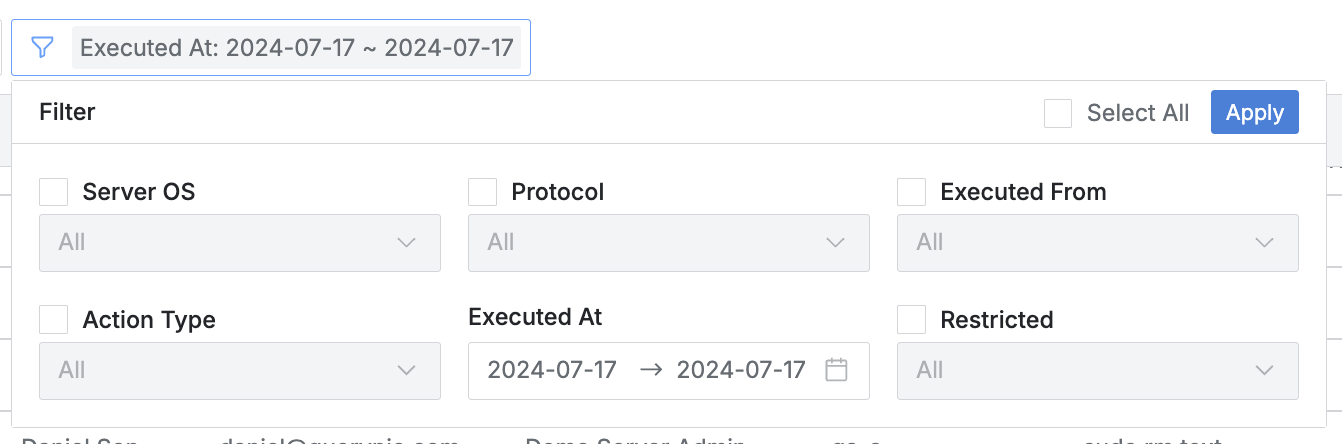
- Server OS : OS of the connected server
- Protocol : Protocol used for connection
- Executed From : Connection method
- web : Connection through QueryPie Web
- proxy : Connection through Agent or Seamless SSH Connection
- Action Type : Recorded event type
- Command : Logged command
- File Download : (SFTP) File download
- File Upload : (SFTP) File upload
- Process Start : (RDP) Process execution
- Process Stop : (RDP) Process termination
- User Input - MouseClick : (RDP) User mouse click
- User Input - MouseDoubleClick : (RDP) User mouse double click
- User Input - KeyPress : (RDP) User keyboard input
- Executed At : Command execution time
- Restricted : Command blocking status
From 11.3.0, when using filters, multiple items can be selected for Action Type.
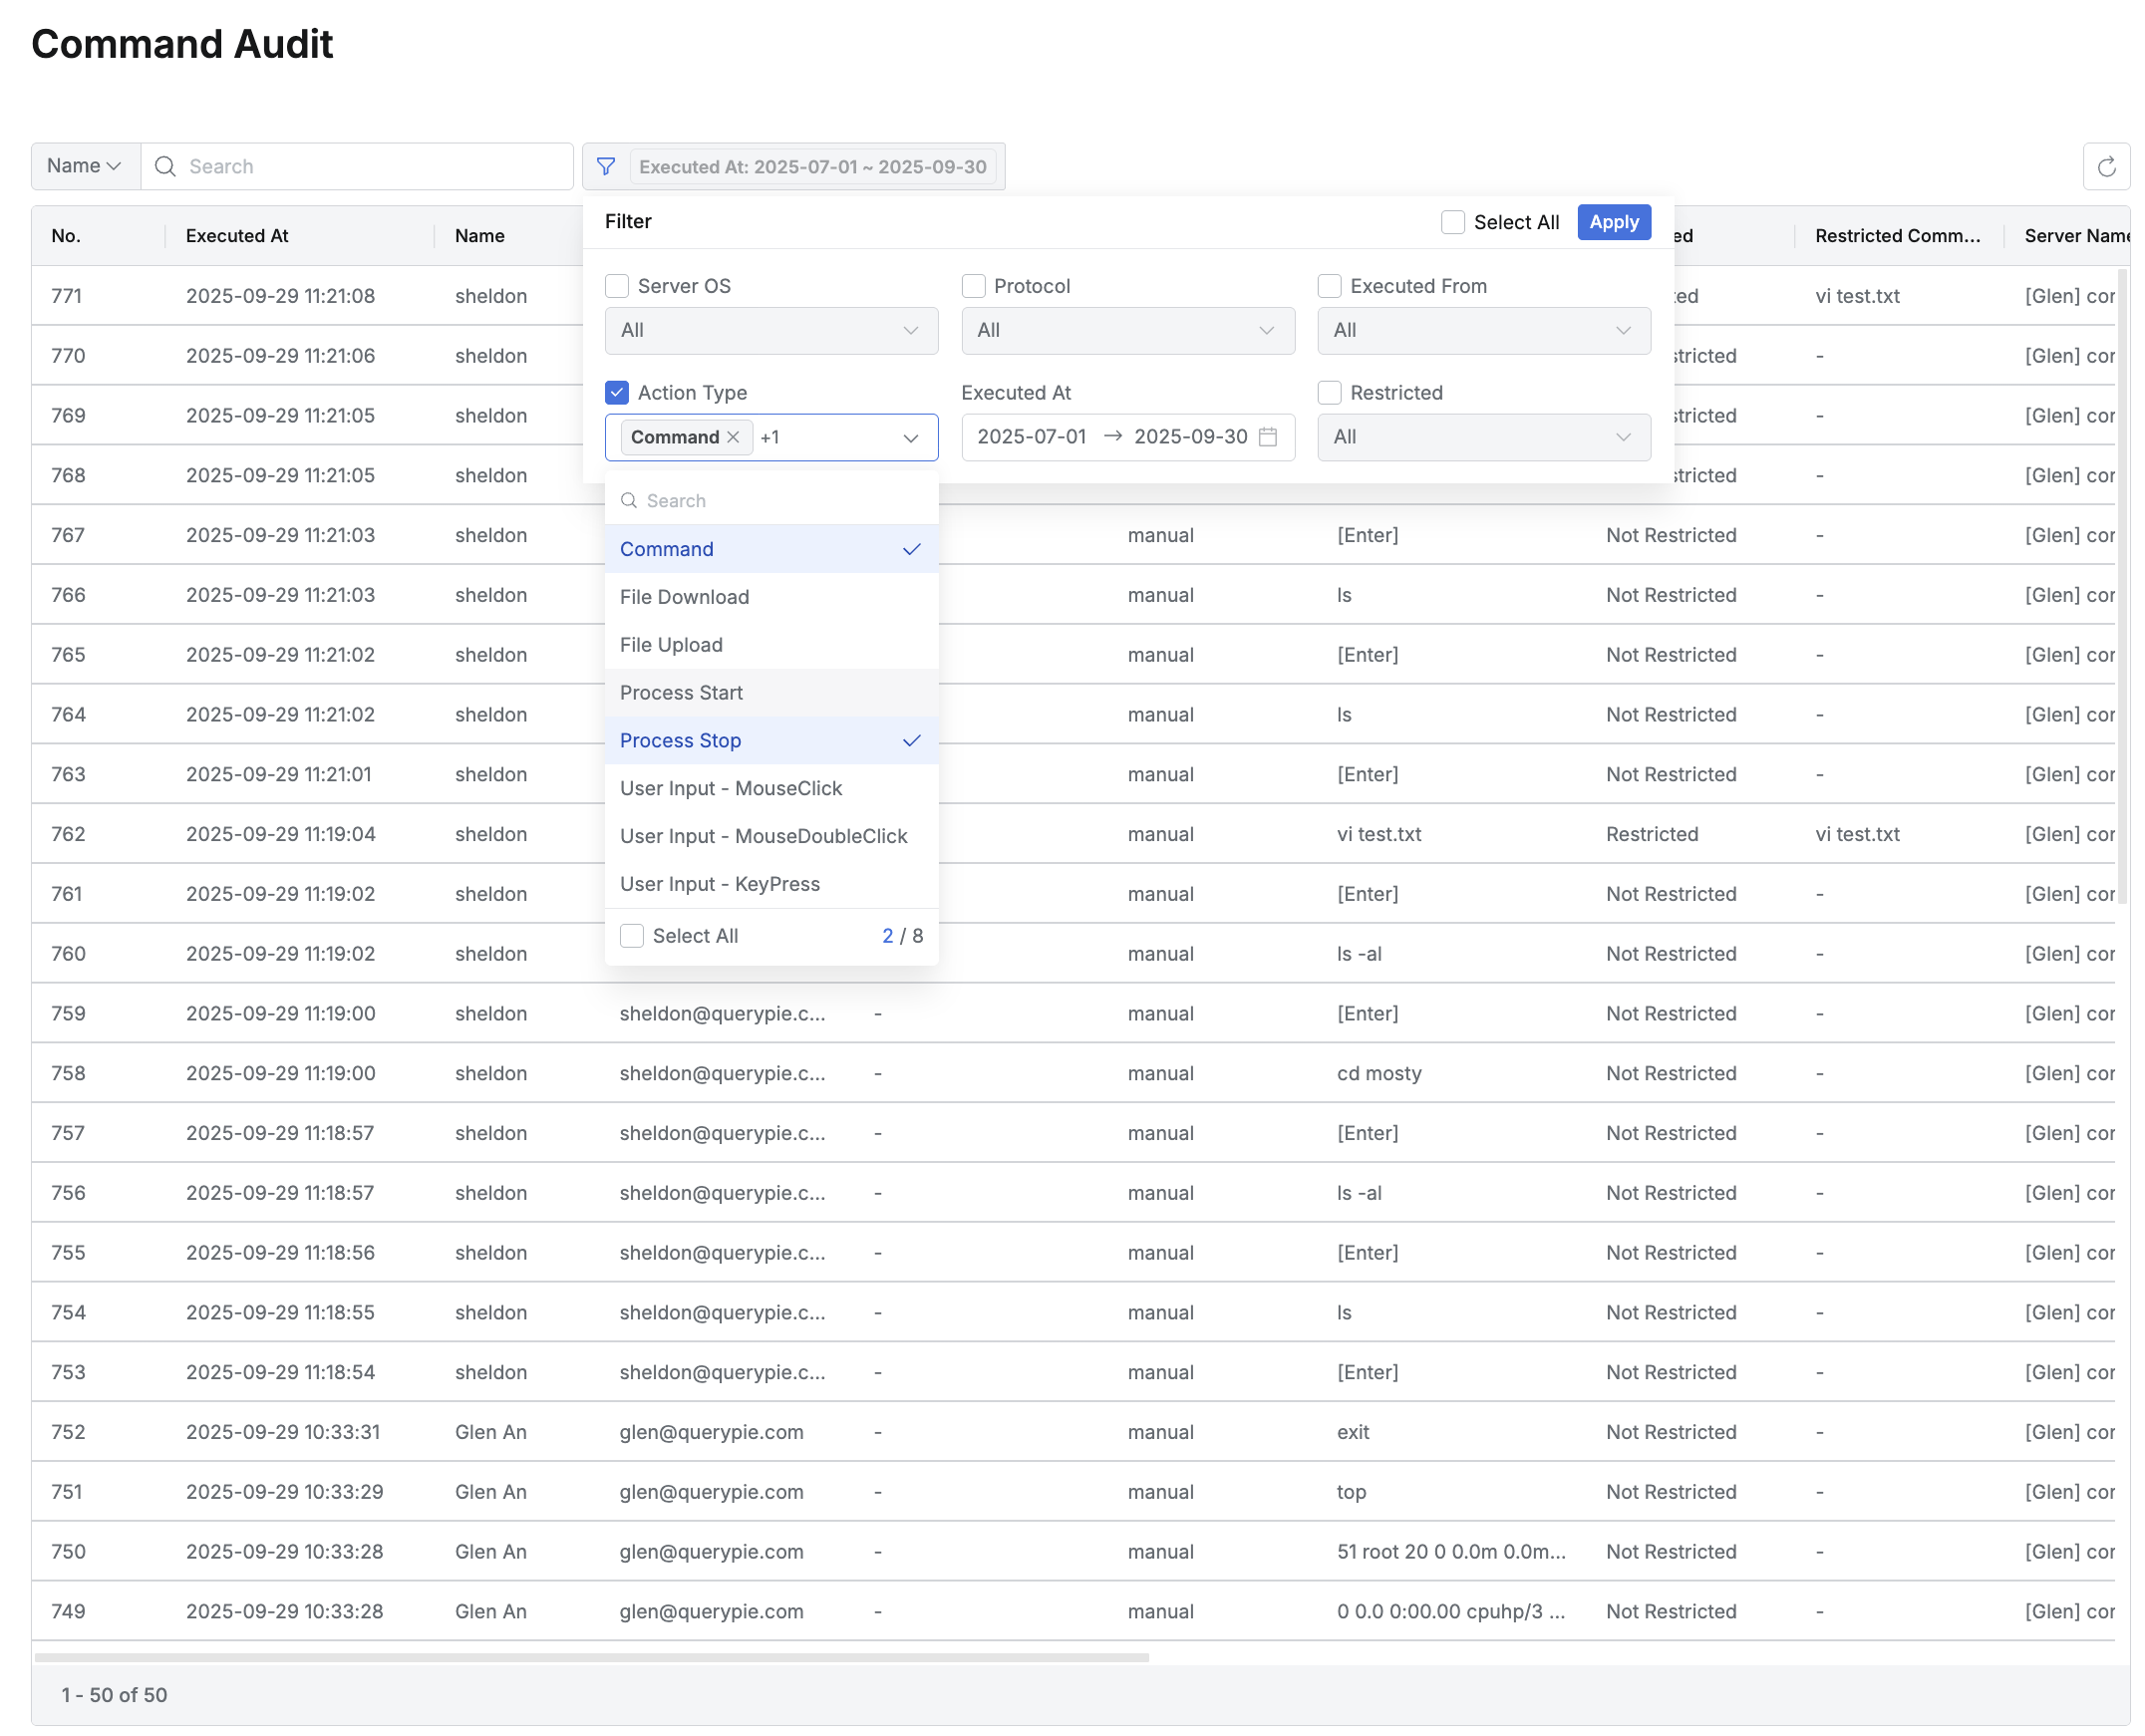
Example of selecting multiple items in Action Type of filter
- You can refresh the log list through the refresh button in the top right of the table.
- The table provides the following column information:
- No : Event identification number
- Executed At : Command execution time
- Name : Target user name
- Email : Target user email
- Role : Role name used when the target user connected
- Account : Server access account
- Command : Executed command
- Restricted : Command blocking status
- Not Restricted
- Restricted
- Restricted Command : Blocked command
- Server Name : Target server name
- Server OS : OS of the connected server
- Host : Host of the connected server
- Port : Port used for connection
- Protocol : Protocol used for connection
- Client IP : User client IP address
- Client Name : User’s connection method
- Action Type : Recorded event type
- Message : Records of unusual events such as connection failures
Viewing Command Audit Details
You can view detailed information by clicking on each row.
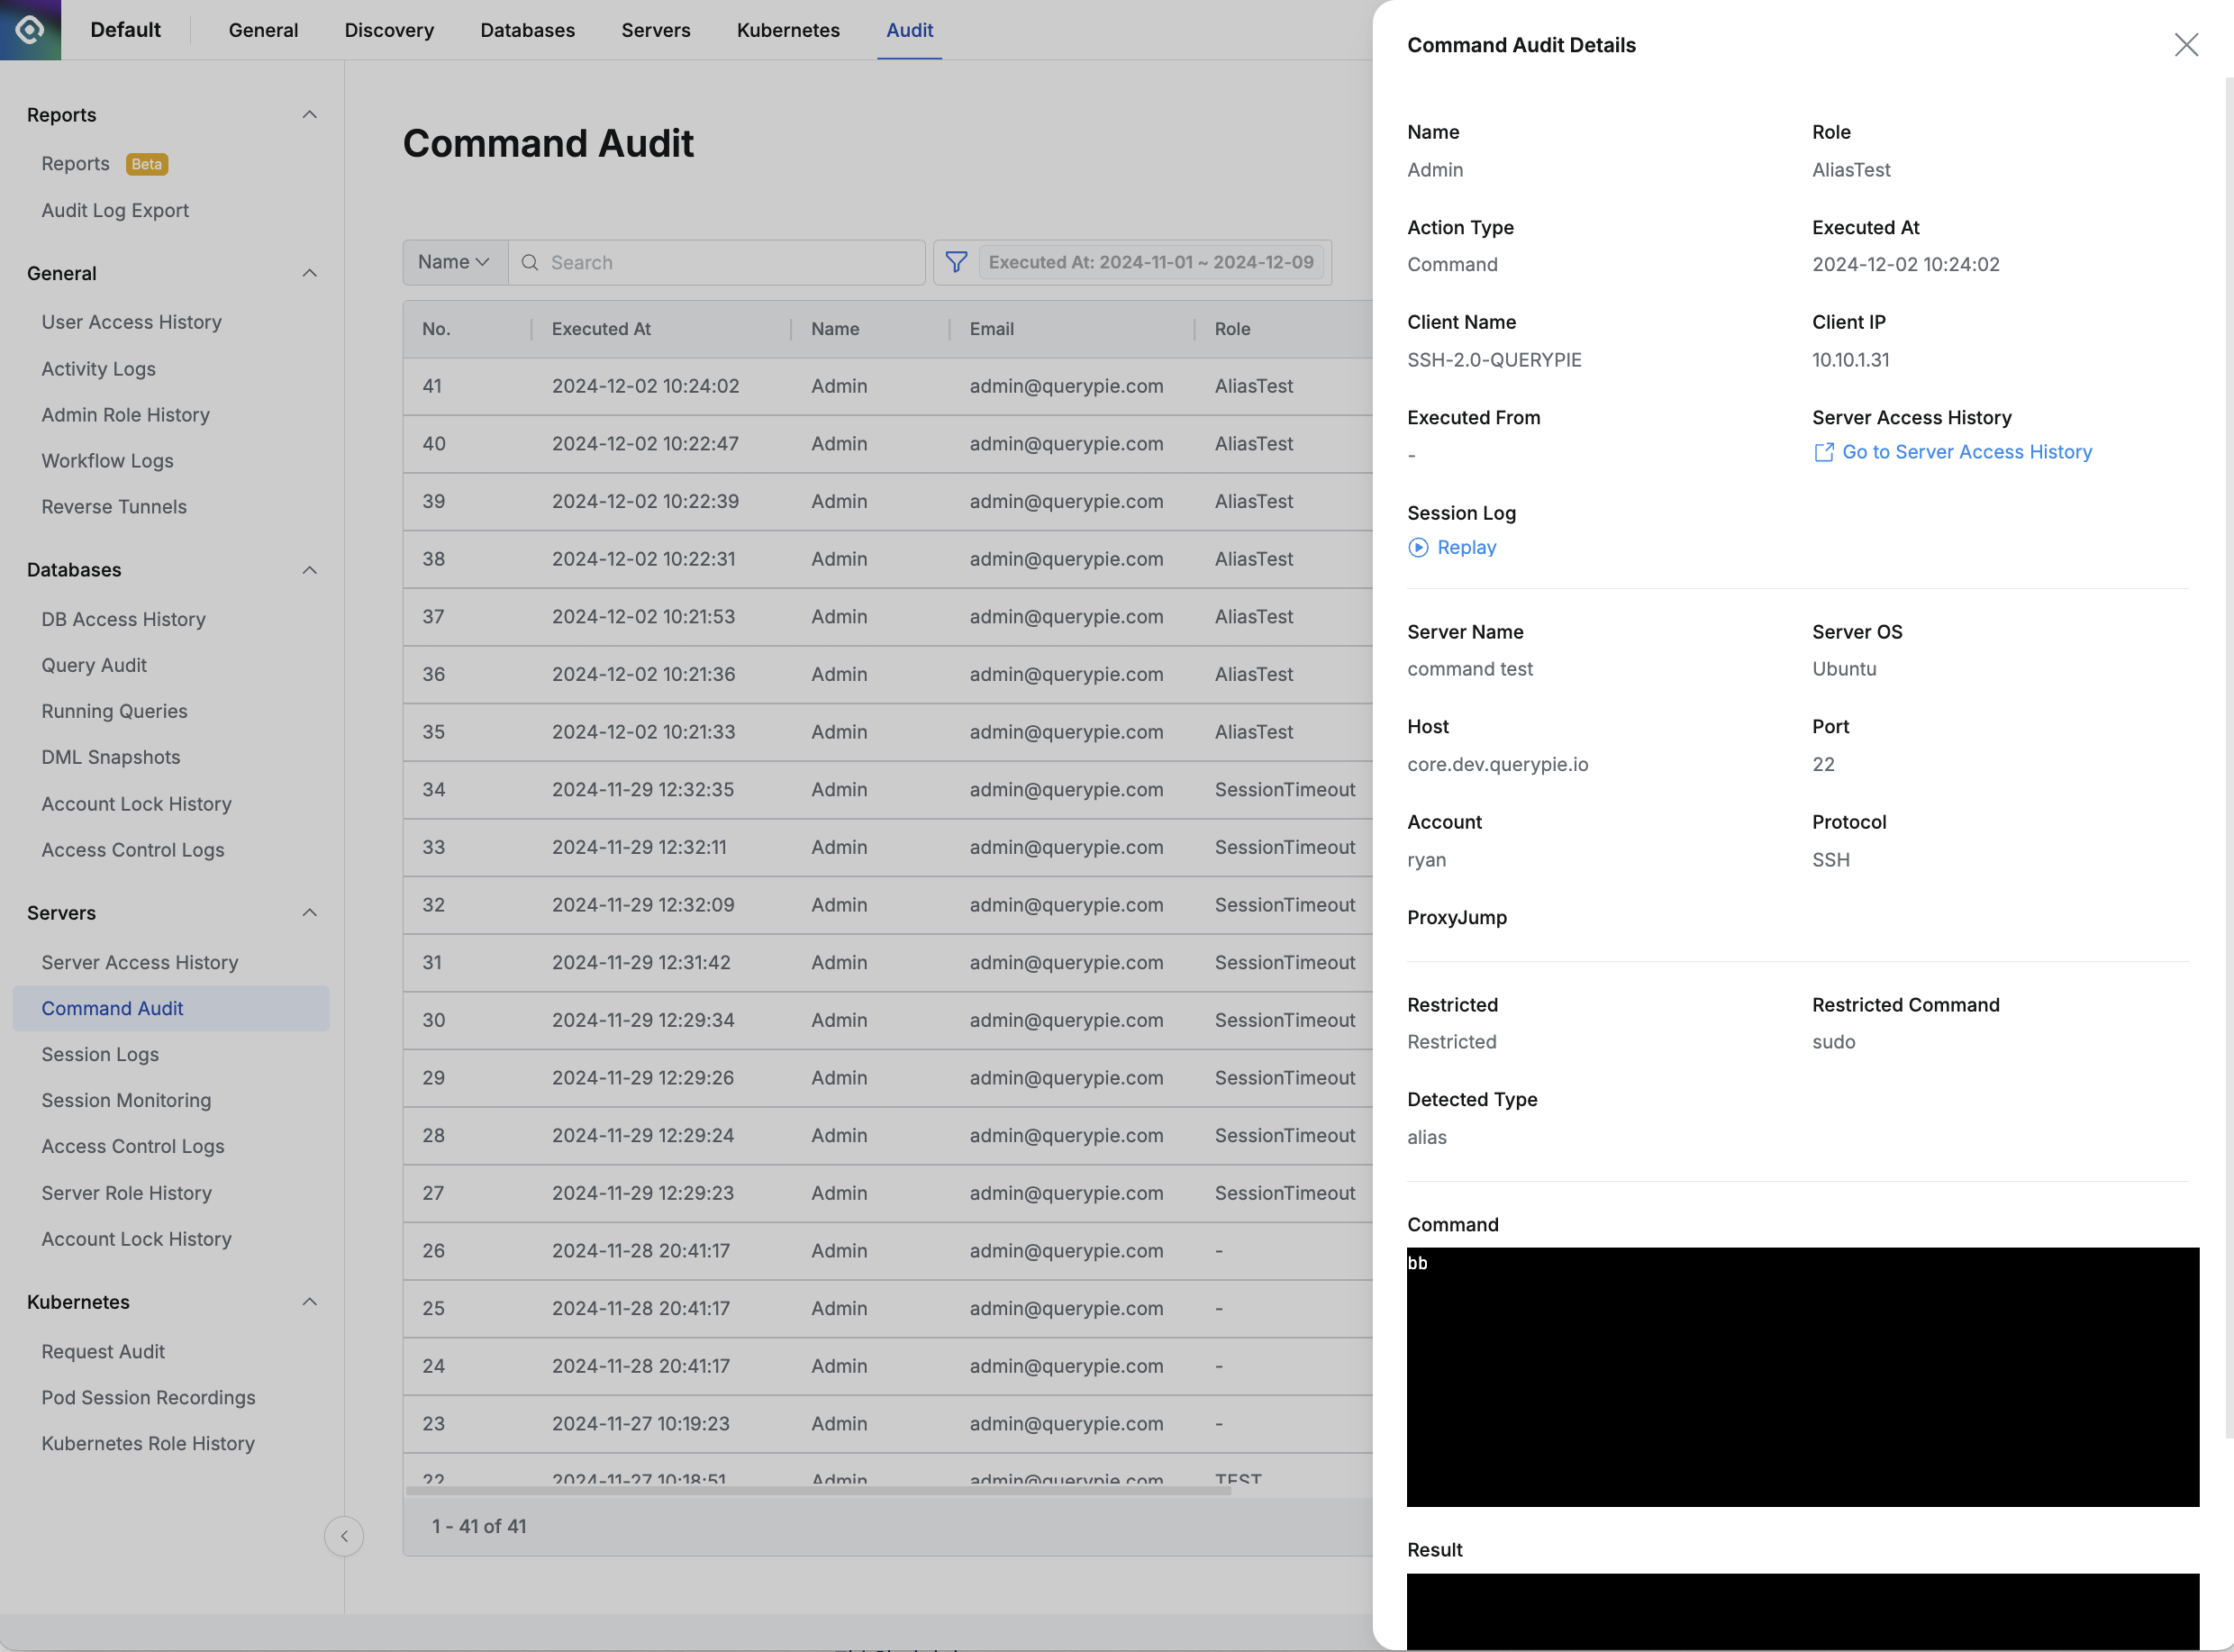
Administrator > Audit > Servers > Command Audit > Command Audit Details
- The right drawer displays the following information:
- Name : Target user name
- Action Type : Recorded event type
- Executed At : Command execution time
- Executed From : Connection method
- Server Access History : Access log for the corresponding session
- Session Log : Session recording view for the session that executed this command
- Server Name : Target server name
- Server OS : OS of the connected server
- Host : Host of the connected server
- Port : Port used for connection
- Account : Server access account
- Protocol : Protocol used for connection
- Client Name : User’s connection method
- Client IP : User client IP address
- Restricted : Command blocking status
- Restricted Command : Blocked command
- Detected Type : Execution method of the detected blocked command (Shell Script or Alias)
- Command : User input command (process name or click coordinates for RDP)
- Result : Command execution result
Even if you press the Enter key multiple times in succession, it is only recorded once in Command Audit.
The actual input content can be checked in the recorded screen of Session Log.
Last updated on