Splunk Integration
Overview
Provides functionality to send audit logs recorded by QueryPie externally through Splunk.
System admin privileges are required for Integration settings.
Recommended Syslog-Splunk Integration Architecture
Recommended Splunk Integration Architecture
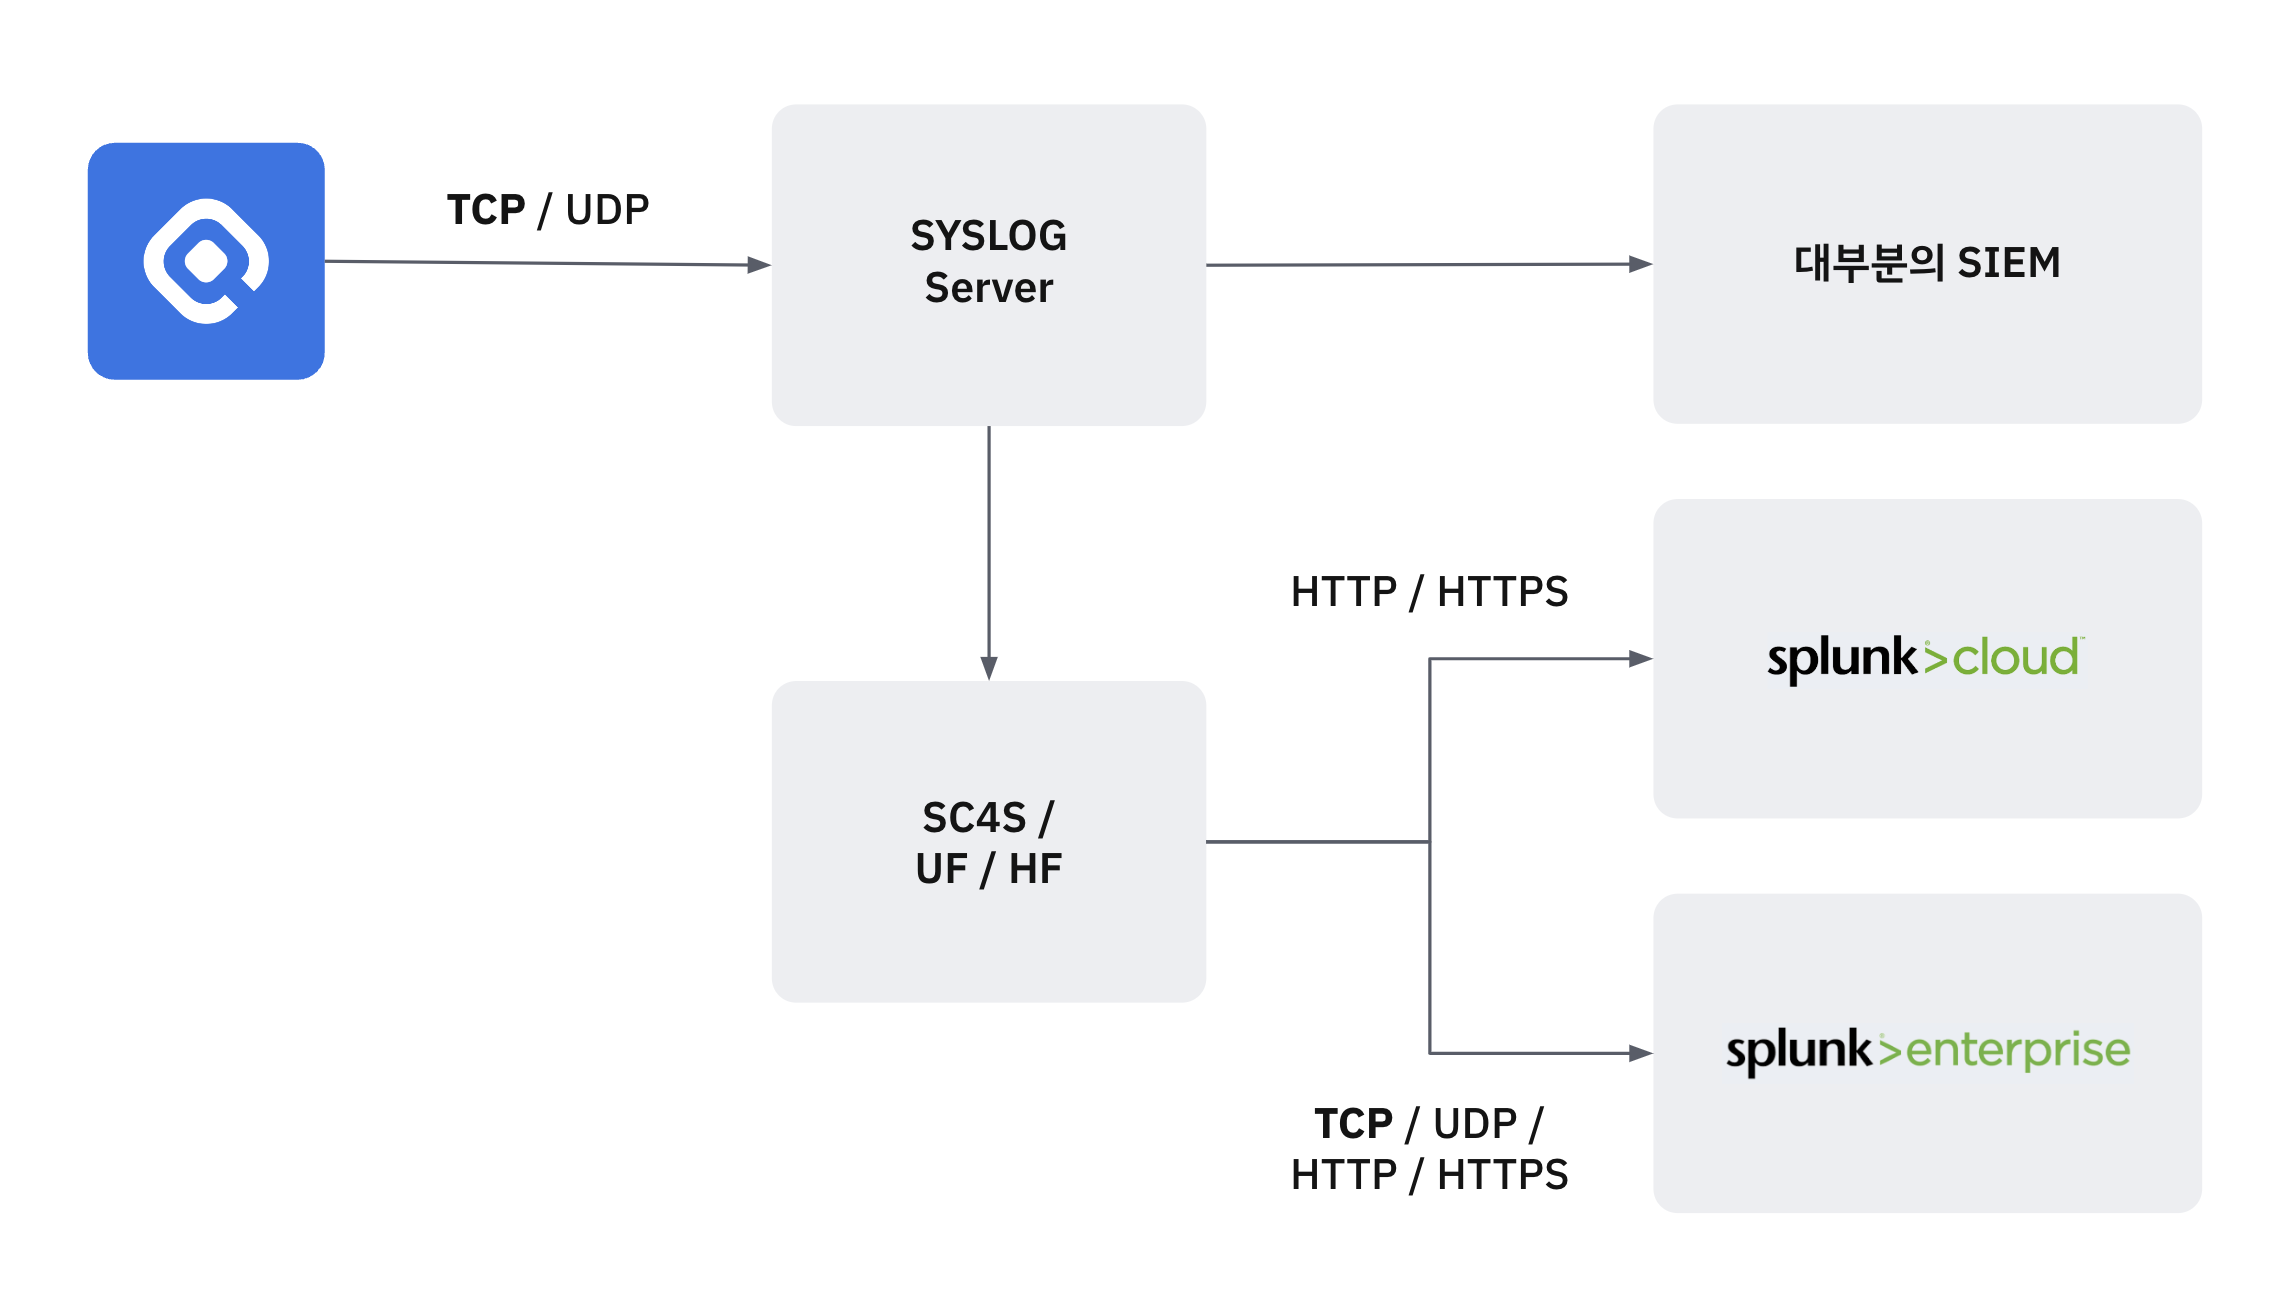
The architecture recommended by Splunk for Syslog-Splunk integration is as follows.
- Primary collection through a separate syslog server, then transmission to Splunk
- Transmission to Splunk through Universal forwarder / Heavy forwarder
QueryPie is configured to allow direct transmission using TCP, UDP, HTTP, HTTPS protocols for customer convenience, but please note that this configuration is not a Splunk recommendation.
For reference, Splunk provides SC4S (Splunk connector for syslog) separately for syslog collection.
Configuring Splunk Integration
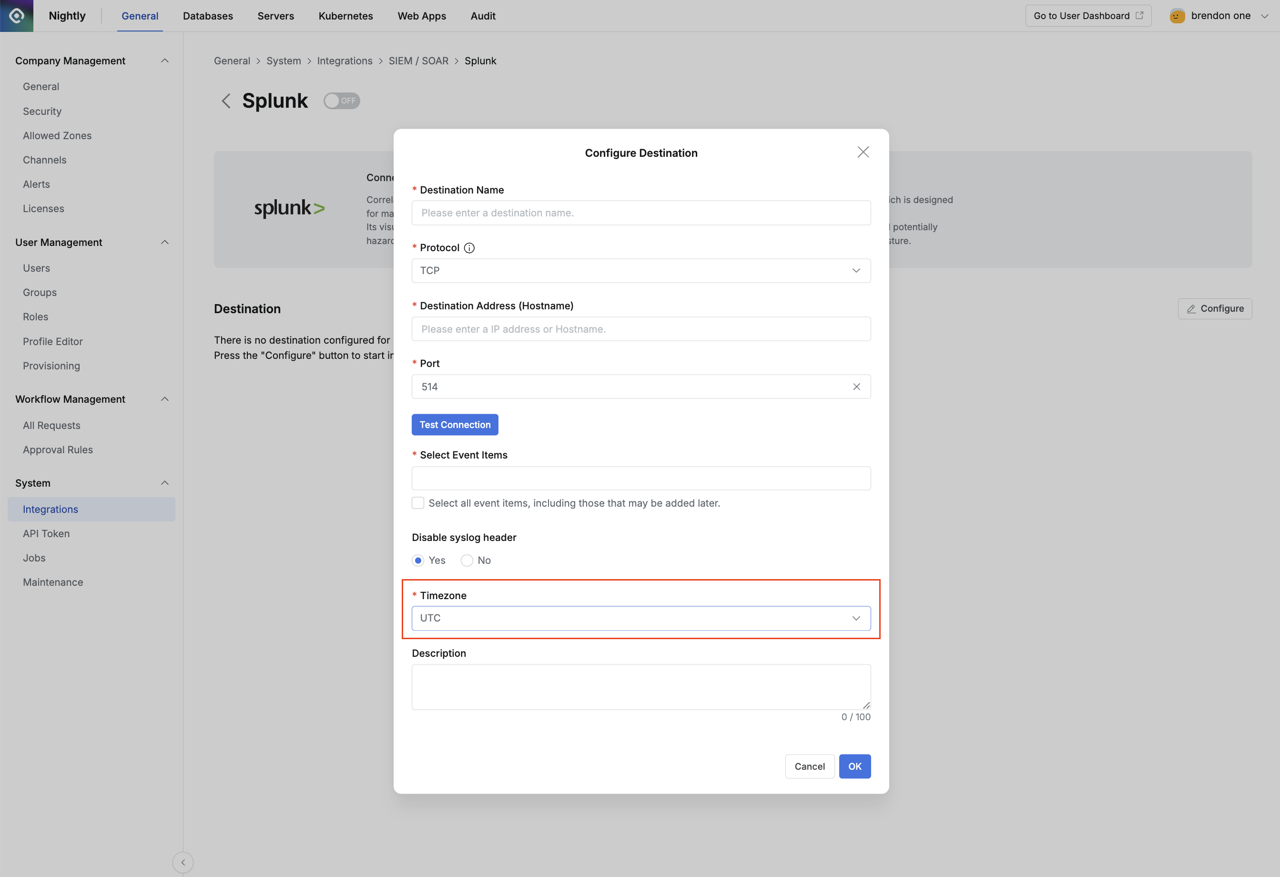
- Navigate to System > Integrations menu in General Settings.
- Click on the Splunk tile to go to the detail page.
- Click the
Configurebutton on the detail page to display a popup where you can enter Destination information.
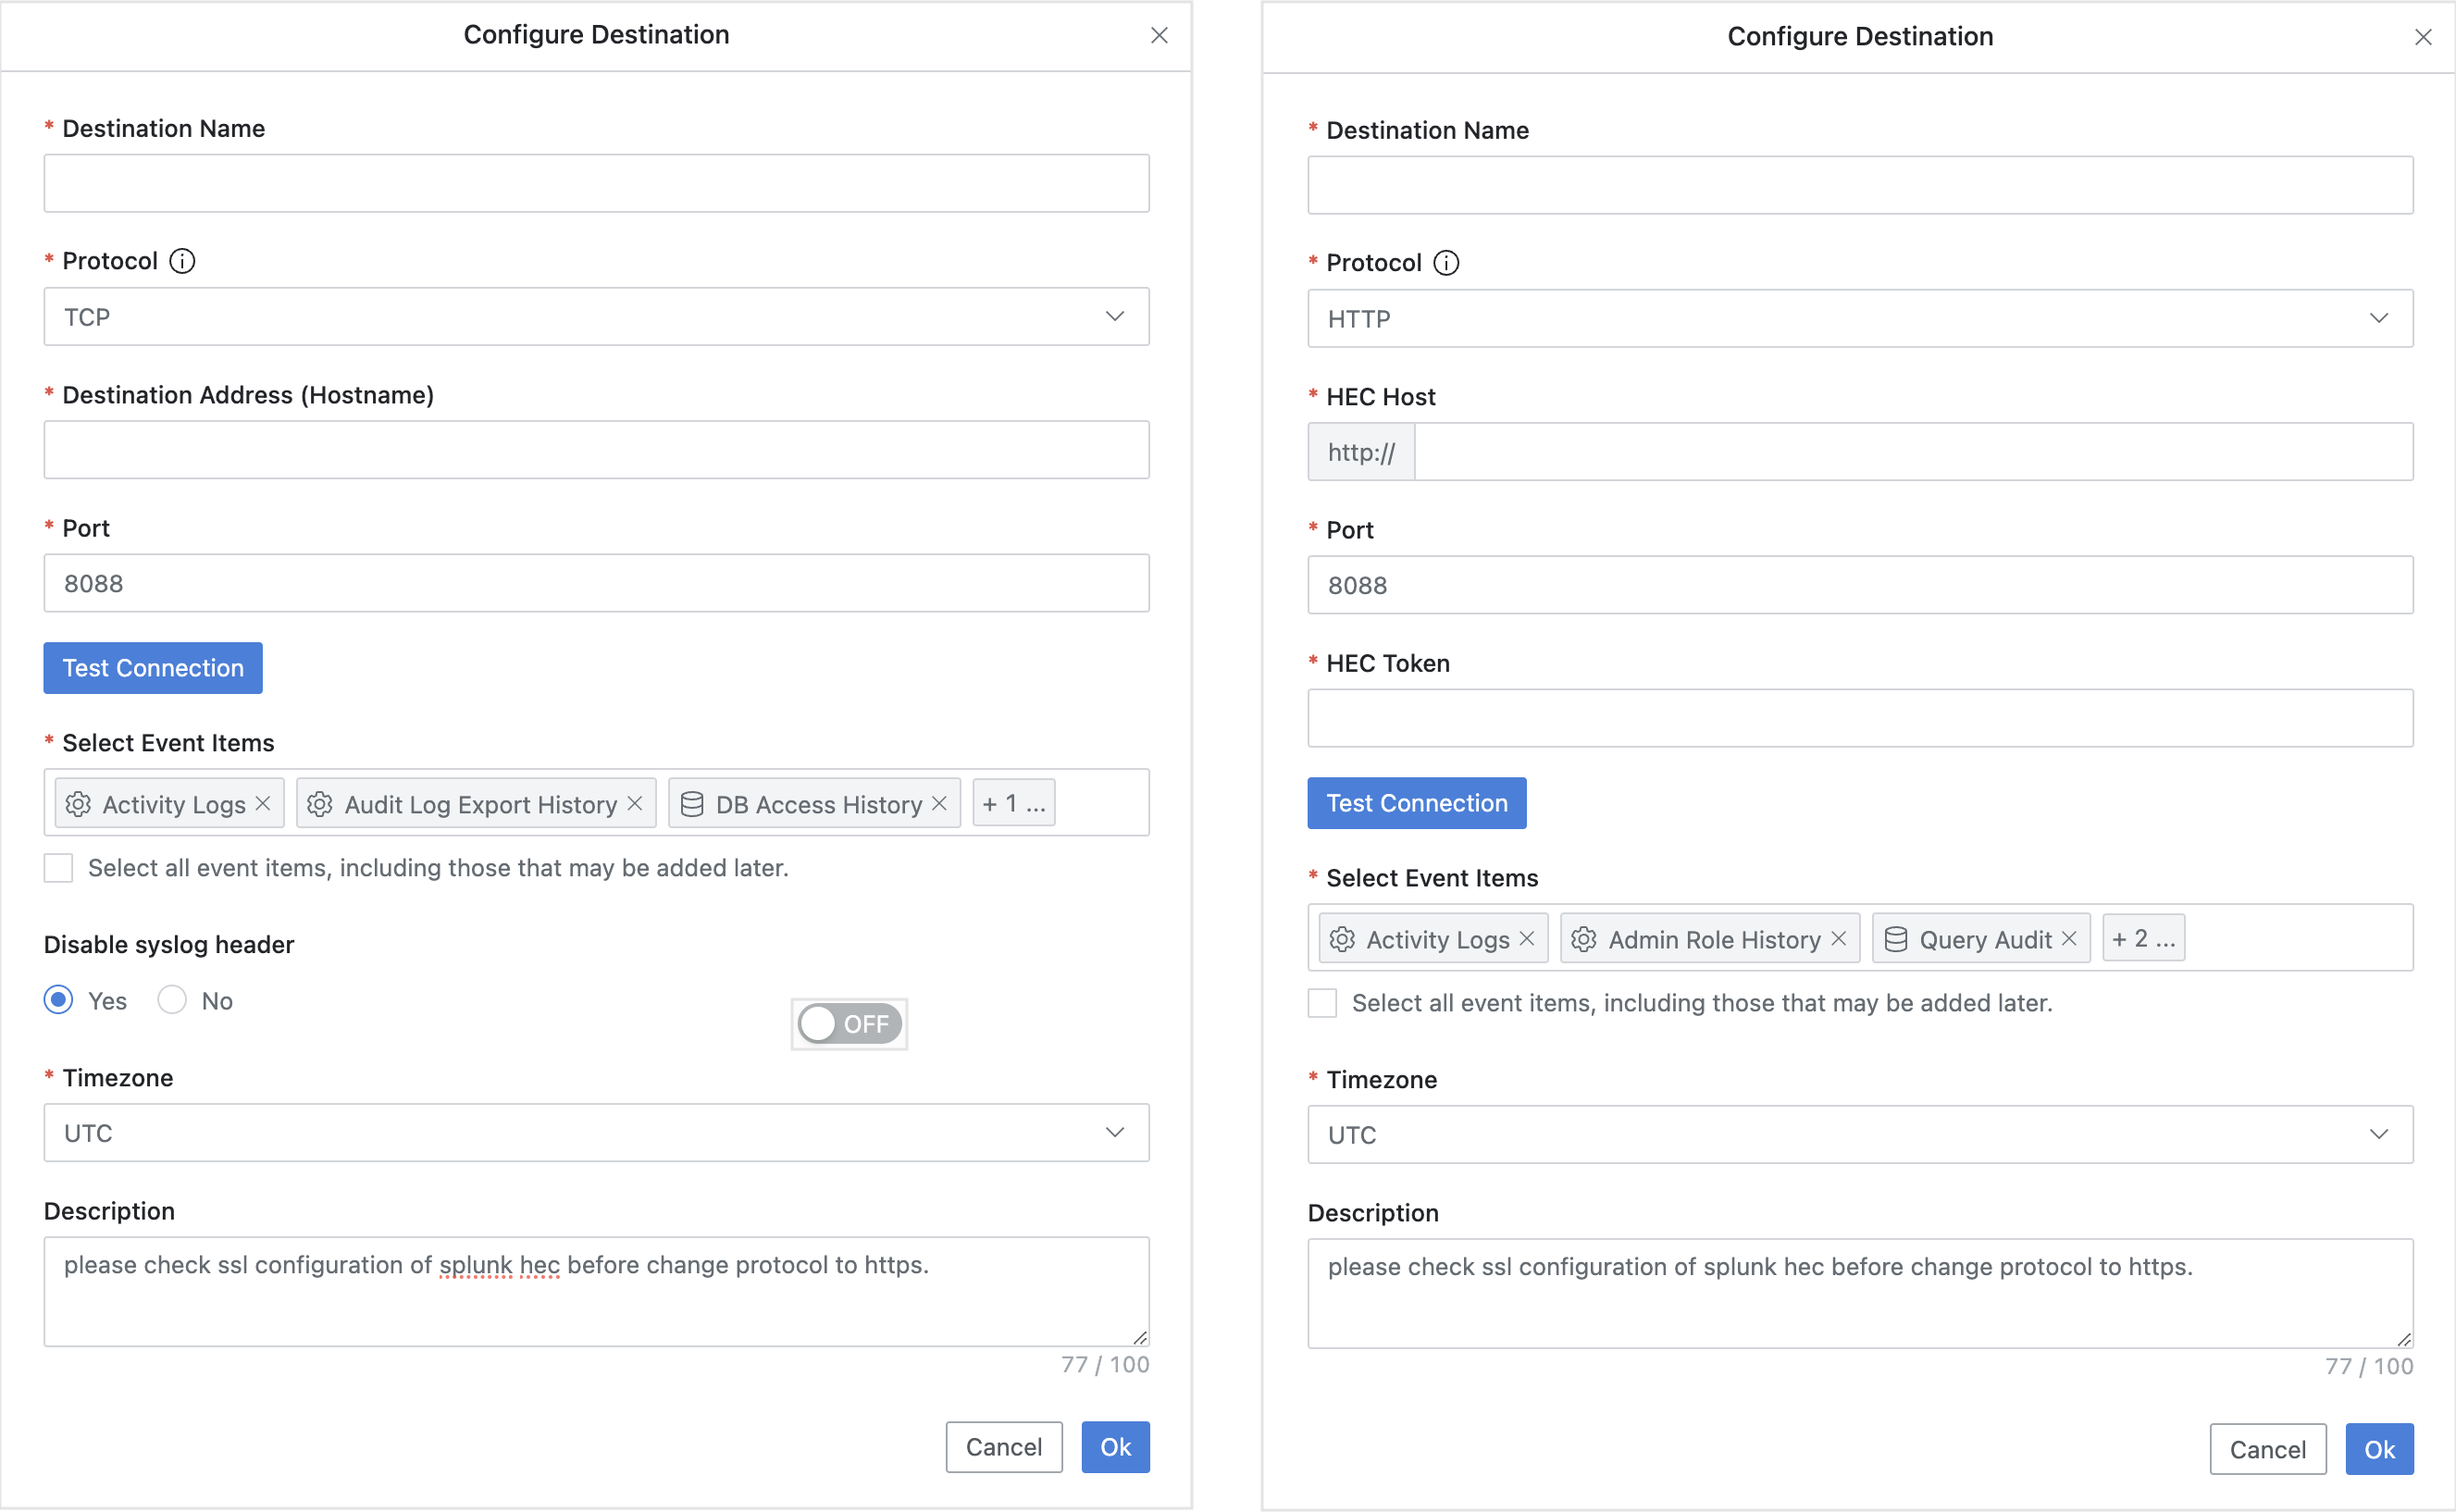
(Left) TCP / UDP Settings Screen (Right) HTTP / HTTPS Settings Screen
- Enter the following information to create Destination information.
- Destination Name : Enter an appropriate name to identify the entity receiving syslog.
- Protocol : Protocols available for transmission to Splunk are TCP (default), UDP, HTTP, HTTPS.
- UDP has packet length constraints and is vulnerable security-wise, so TCP usage is recommended.
- When using Splunk HTTP Event Collector, the default is HTTPS.
- To use HTTP instead of HTTPS, you must first configure Splunk’s HEC option to not use SSL. When selecting HTTP, you must additionally enter the following field values:
- HEC Host : Enter the hostname or IP address of the Splunk server.
- HEC Token : Enter the Splunk HEC token value.
- Destination Address (Hostname): Enter the IP address or hostname of the Splunk server or forwarder receiving syslog. For HTTP, HTTPS protocols, this changes to HEC Host input.
- Port : Enter the listening port of the syslog server. (TCP/UDP default 514)
- Splunk HEC port must be checked in Splunk settings first before entering.
- When selecting HTTP/HTTPS protocol in Splunk menu:
- Enter the port number set in Splunk HTTP Event Collector’s global option. Default is 8088.
- For Splunk Cloud users, enter 443.
- HEC Token : For HTTP, HTTPS protocols, you must enter the token value created when configuring Splunk’s HEC.
- Test Connection button : TCP, HTTP, HTTPS protocols can check communication status with the target.
- UDP cannot check communication status due to protocol characteristics, so the Test Connection button is disabled.
- Select Event Items : You can selectively send event items. Selecting the “Select all event items, including those that may be added later.” checkbox at the bottom sends all available events.
- Disable syslog header : Sends without syslog header information (default Yes). This is an option provided to remove syslog headers when some SIEMs have difficulty parsing JSON. For HTTP, HTTPS, this option cannot be used and is always sent without syslog headers.
- Description : Enter brief information within 100 characters about the configuration information.
- Click the
OKbutton to save the settings.- Even if settings are saved, syslog is not immediately transmitted.
- To start transmission, switch the toggle button in the top left of the page to
ON.- This transmission toggle button can be used when transmission needs to be temporarily stopped for maintenance or various situations.
- If syslog transmission is no longer needed, you can remove the configuration through the
Deletebutton.- However, deletion is not possible while transmitting, so please change the transmission toggle button to :toggleoff: before deleting.
Timezone settings have been added in 11.3.0. Previously, Timezone settings were only available in Syslog (Legacy), but now Timezone settings are available for all SIEM-related settings (Syslog, Splunk). Additionally, streaming transmission functionality for events generated by the New DAC Policy Management feature has been added. (Select DAC Policy Audit Logs in Select Event Items.)
Reference
- QueryPie event items transmitted through syslog according to license
| Event Item | DAC | SAC | KAC |
|---|---|---|---|
| User Access History | O | O | O |
| Activity Logs | O | O | O |
| Admin Role History | O | O | O |
| Audit Log Export | O | O | O |
| DB Access History | O | N/A | N/A |
| Query Audit | O | N/A | N/A |
| DML Snapshot | O | N/A | N/A |
| DB Access Control Logs | O | N/A | N/A |
| Account Lock History | O | N/A | N/A |
| Server Access History | N/A | O | N/A |
| Server Command Audit | N/A | O | N/A |
| Server Session Logs | N/A | O | N/A |
| Server Access Control Logs | N/A | O | N/A |
| Workflow Logs | O | O | O |
| Approval Urgent Waiting Logs | O | O | O |
| Request Audit | N/A | N/A | O |
| Kubernetes Role History | N/A | N/A | O |
Pod Session Recordings are not supported for syslog transmission because they duplicate the list and details of pods/exec resource calls within Request Audit.