Connecting to Kubernetes Clusters with Web Client
Overview
KAC Web Client is currently provided as Beta.
With KAC Web Client, you can access Kubernetes clusters directly from your browser without installing a separate Agent, and explore and manage resources.
You can enter from the cluster detail screen in the Kubernetes menu using the Connect button, or if you have already selected a Role and a specific cluster, you can go directly to Web Client from the top menu on the user page.
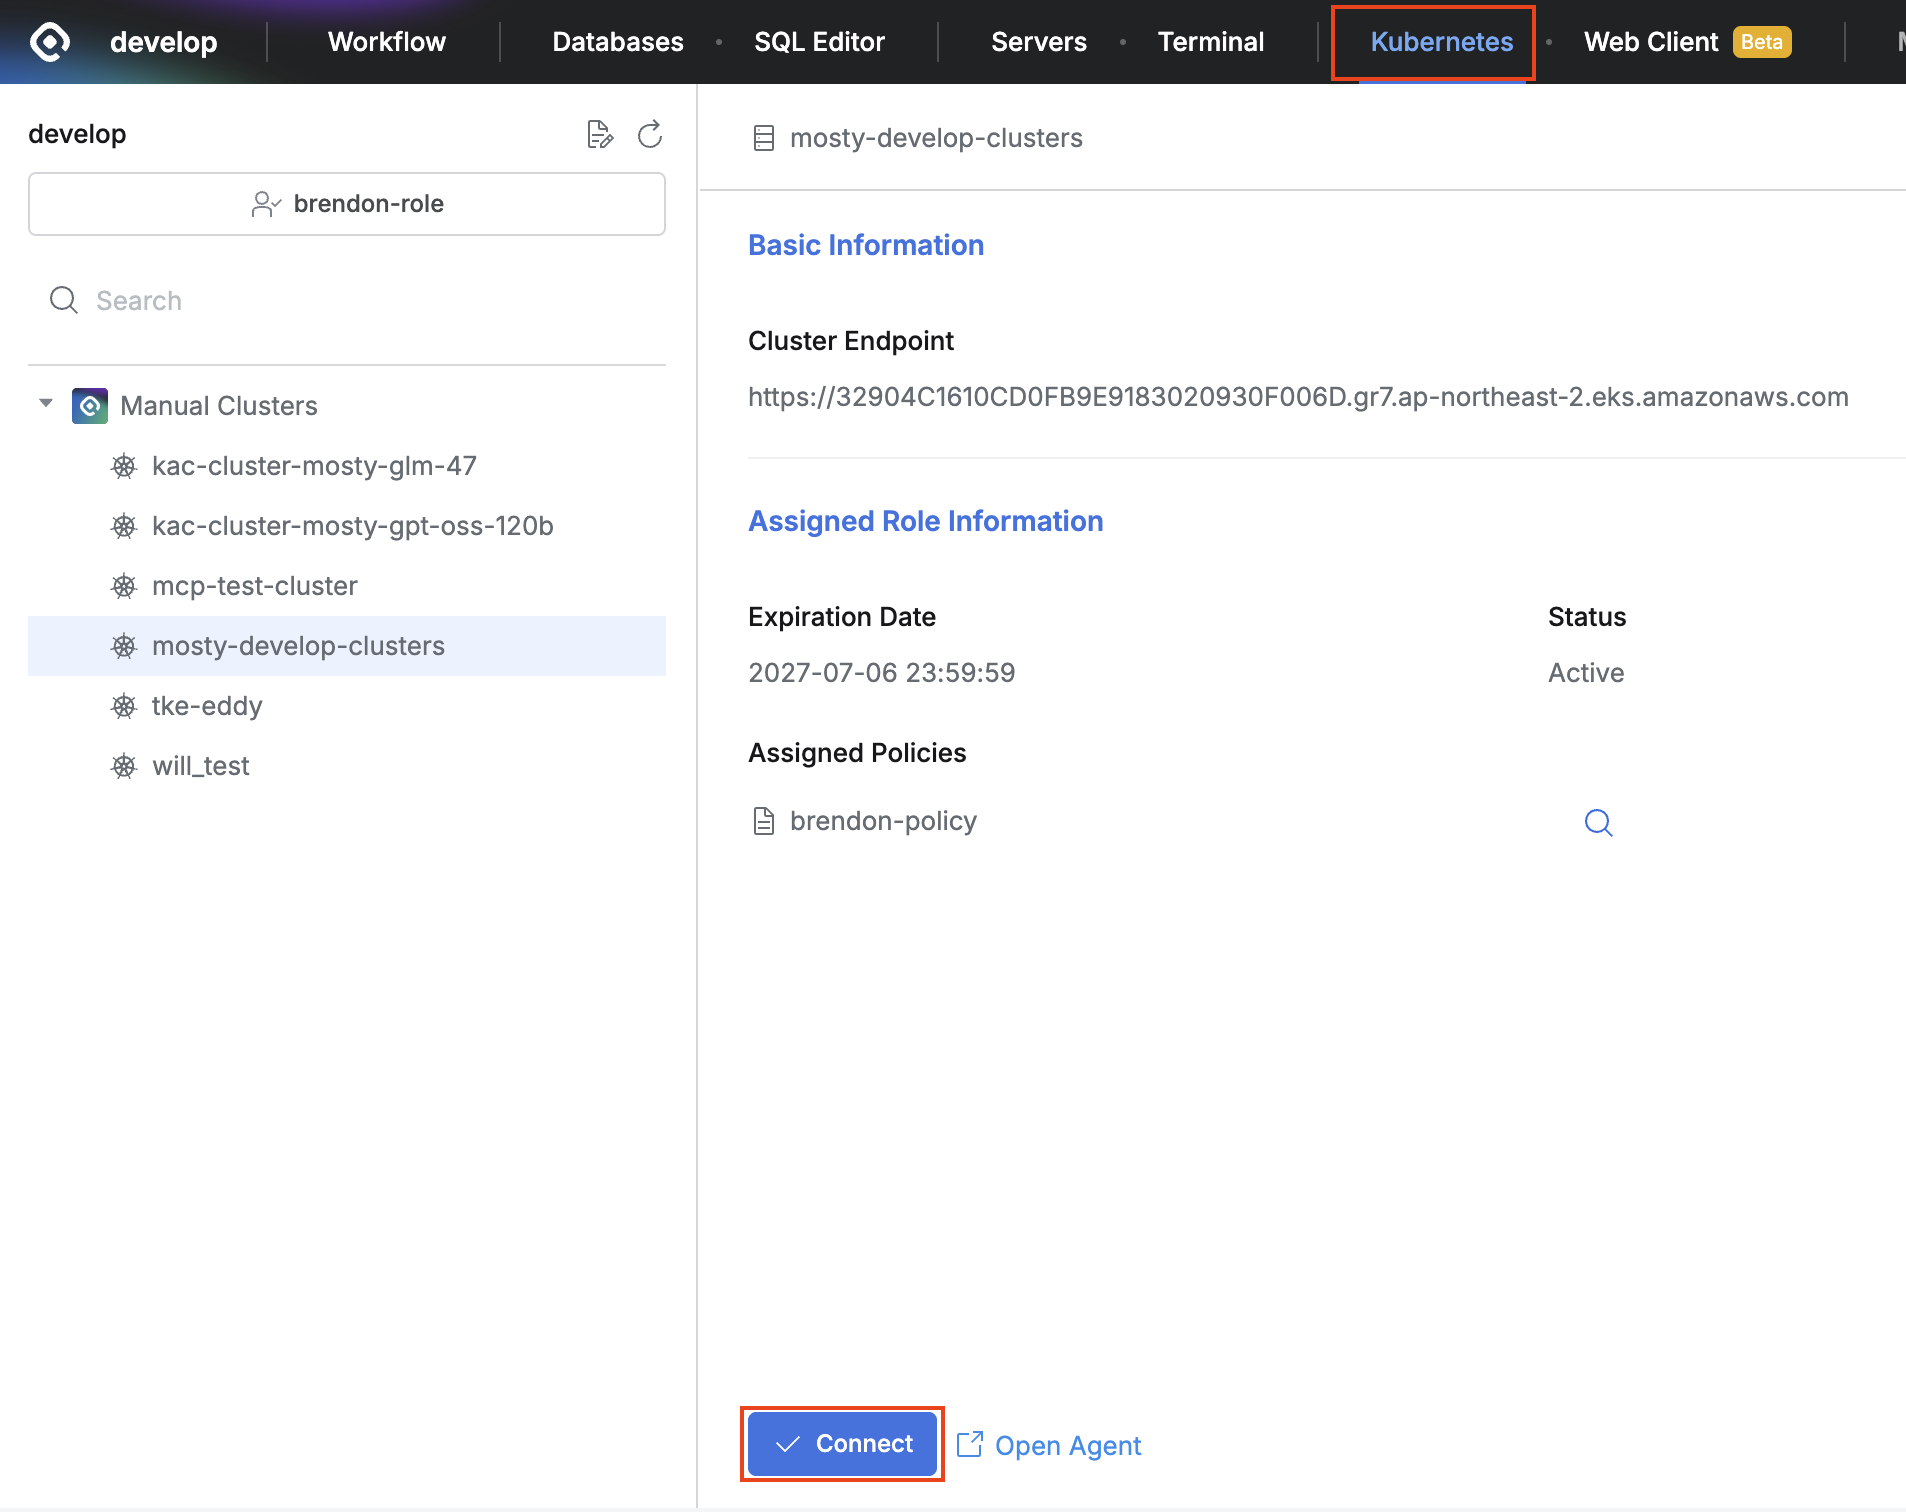
Move to the Web Client screen by selecting a specific cluster on the cluster detail screen and clicking the Connect button
Web Client Screen Layout
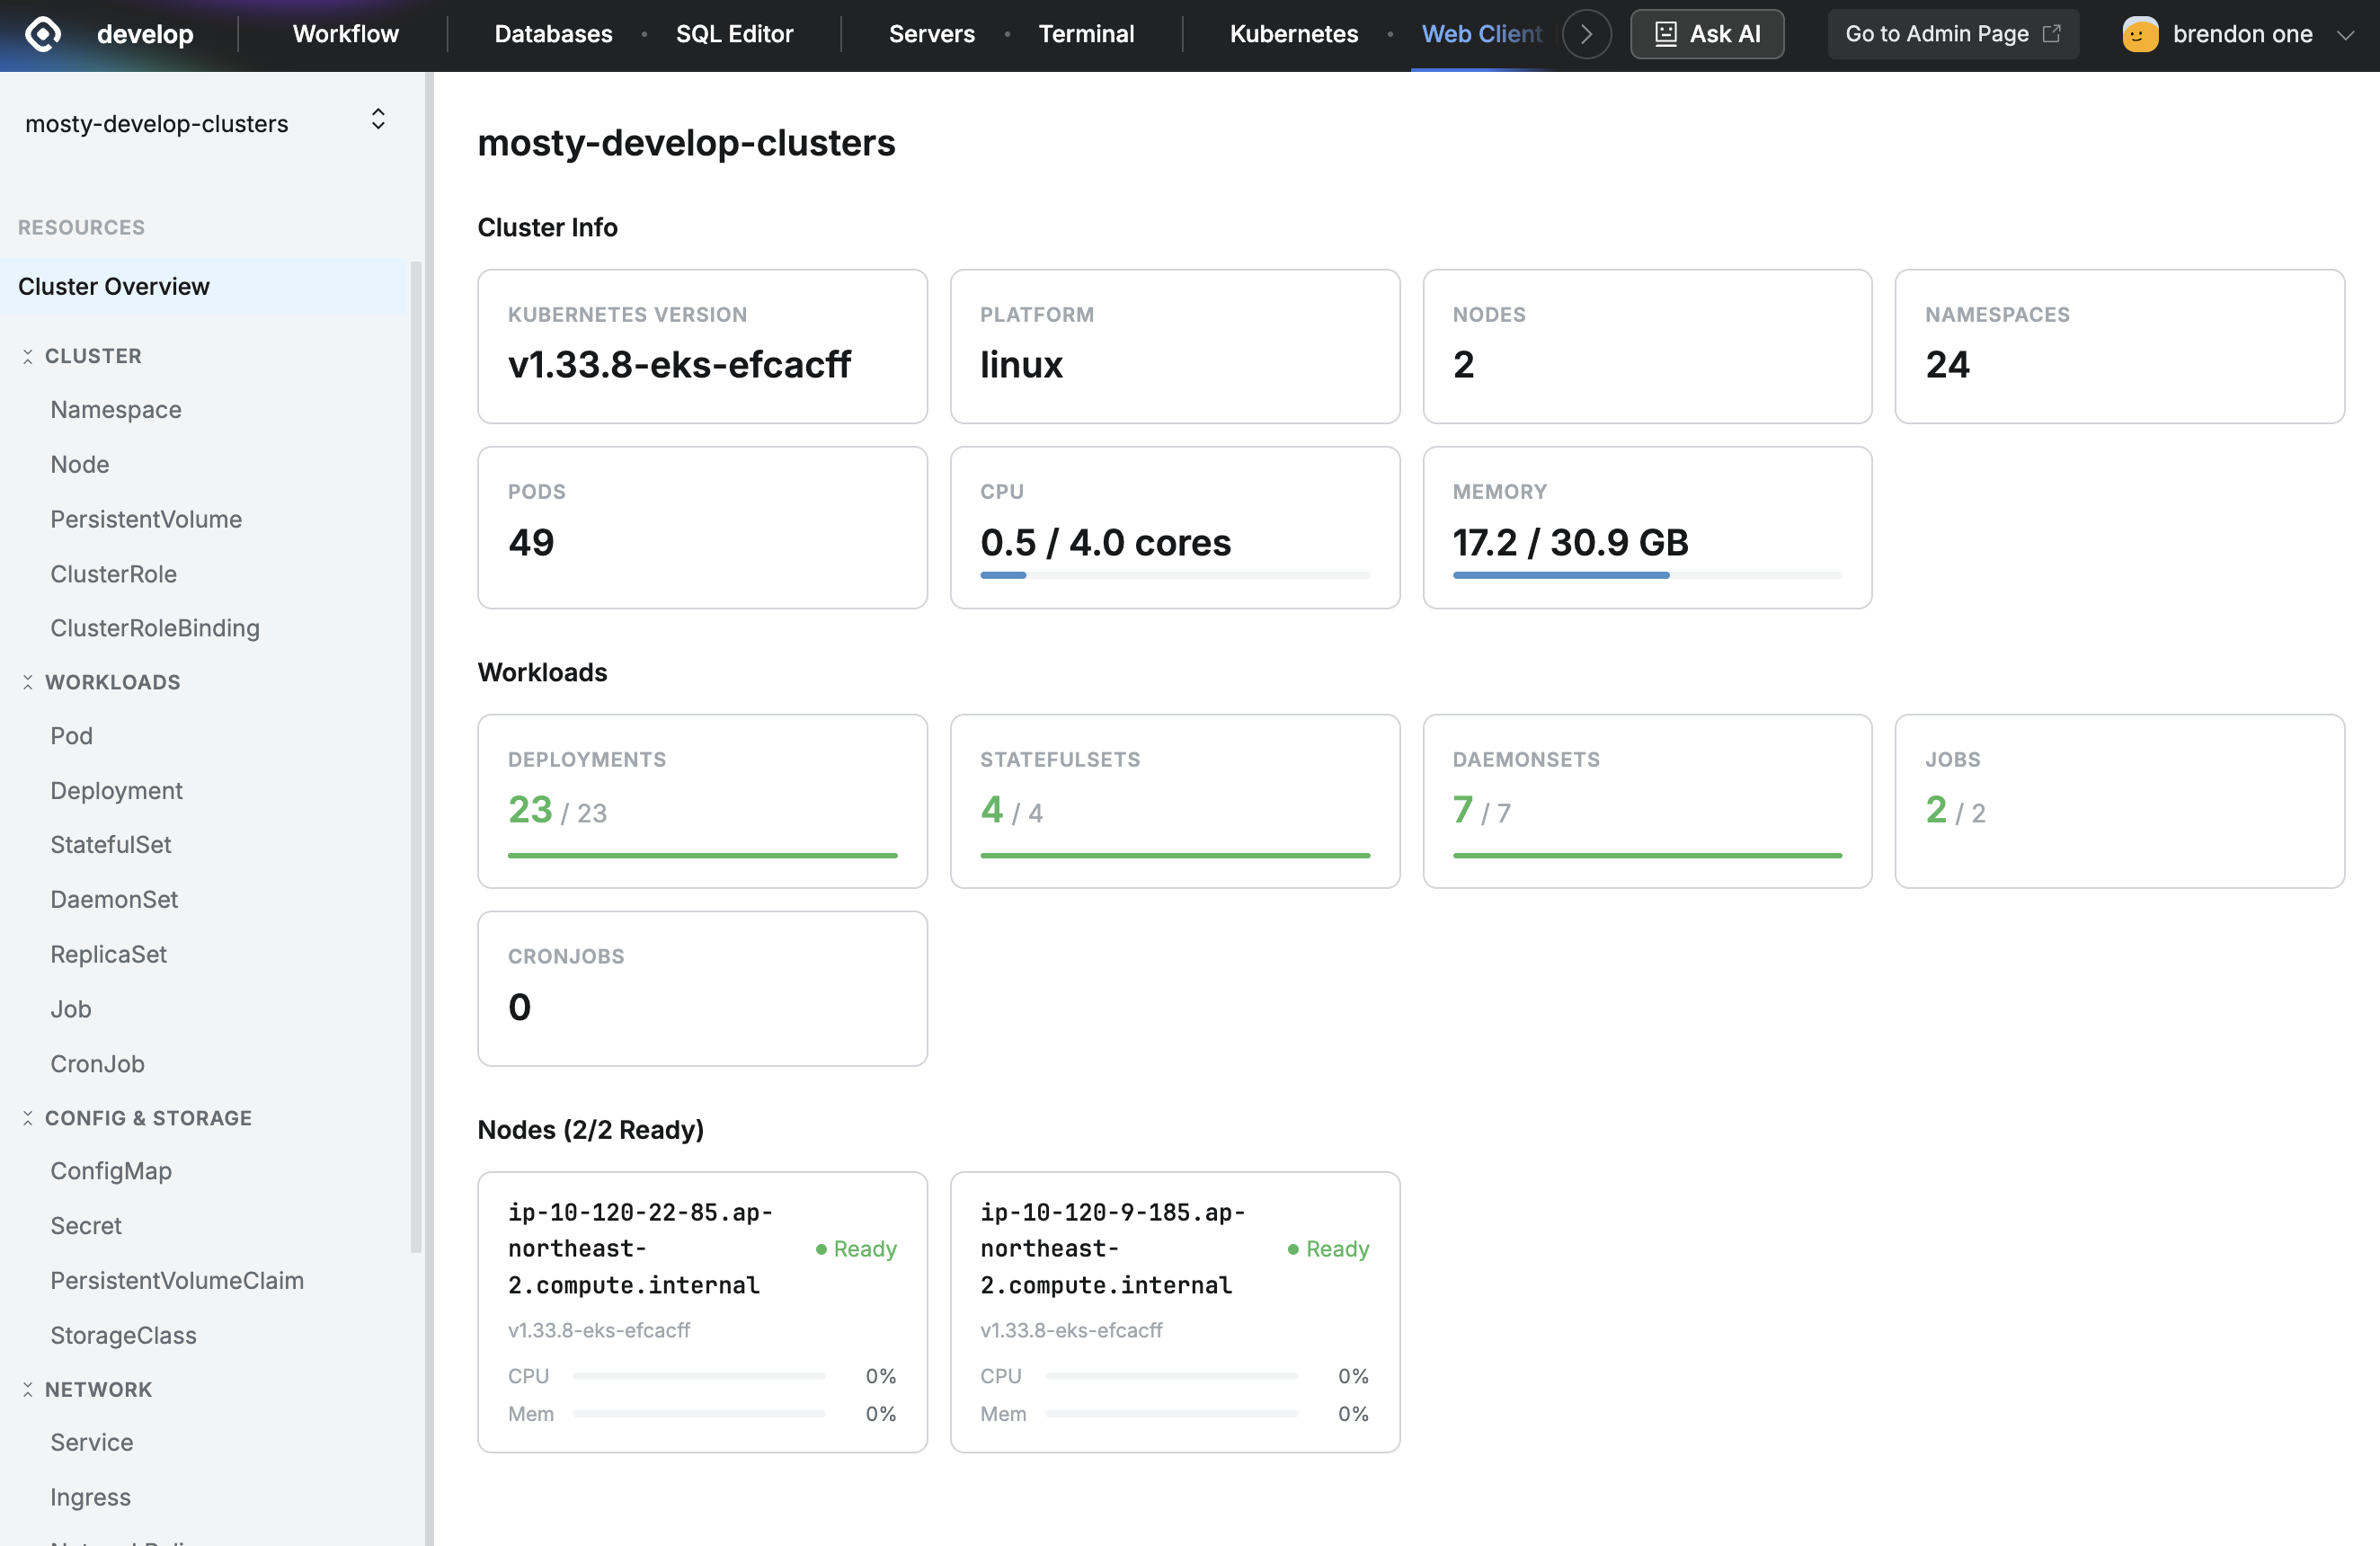
The Web Client Cluster Overview displayed after connecting to a Role and a specific cluster
When you connect, the Cluster Overview screen appears, where you can check the overall status of the cluster.
- Left sidebar (Resource Browser): Browse resources in the cluster by category.
- Right main area: Displays the list or details of the selected resource.
- Bottom panel: Displays Pod logs and Shell terminal in tab format. It appears when you click the
LogsorShellbutton on the detail screen displayed after clicking a specific target in the list.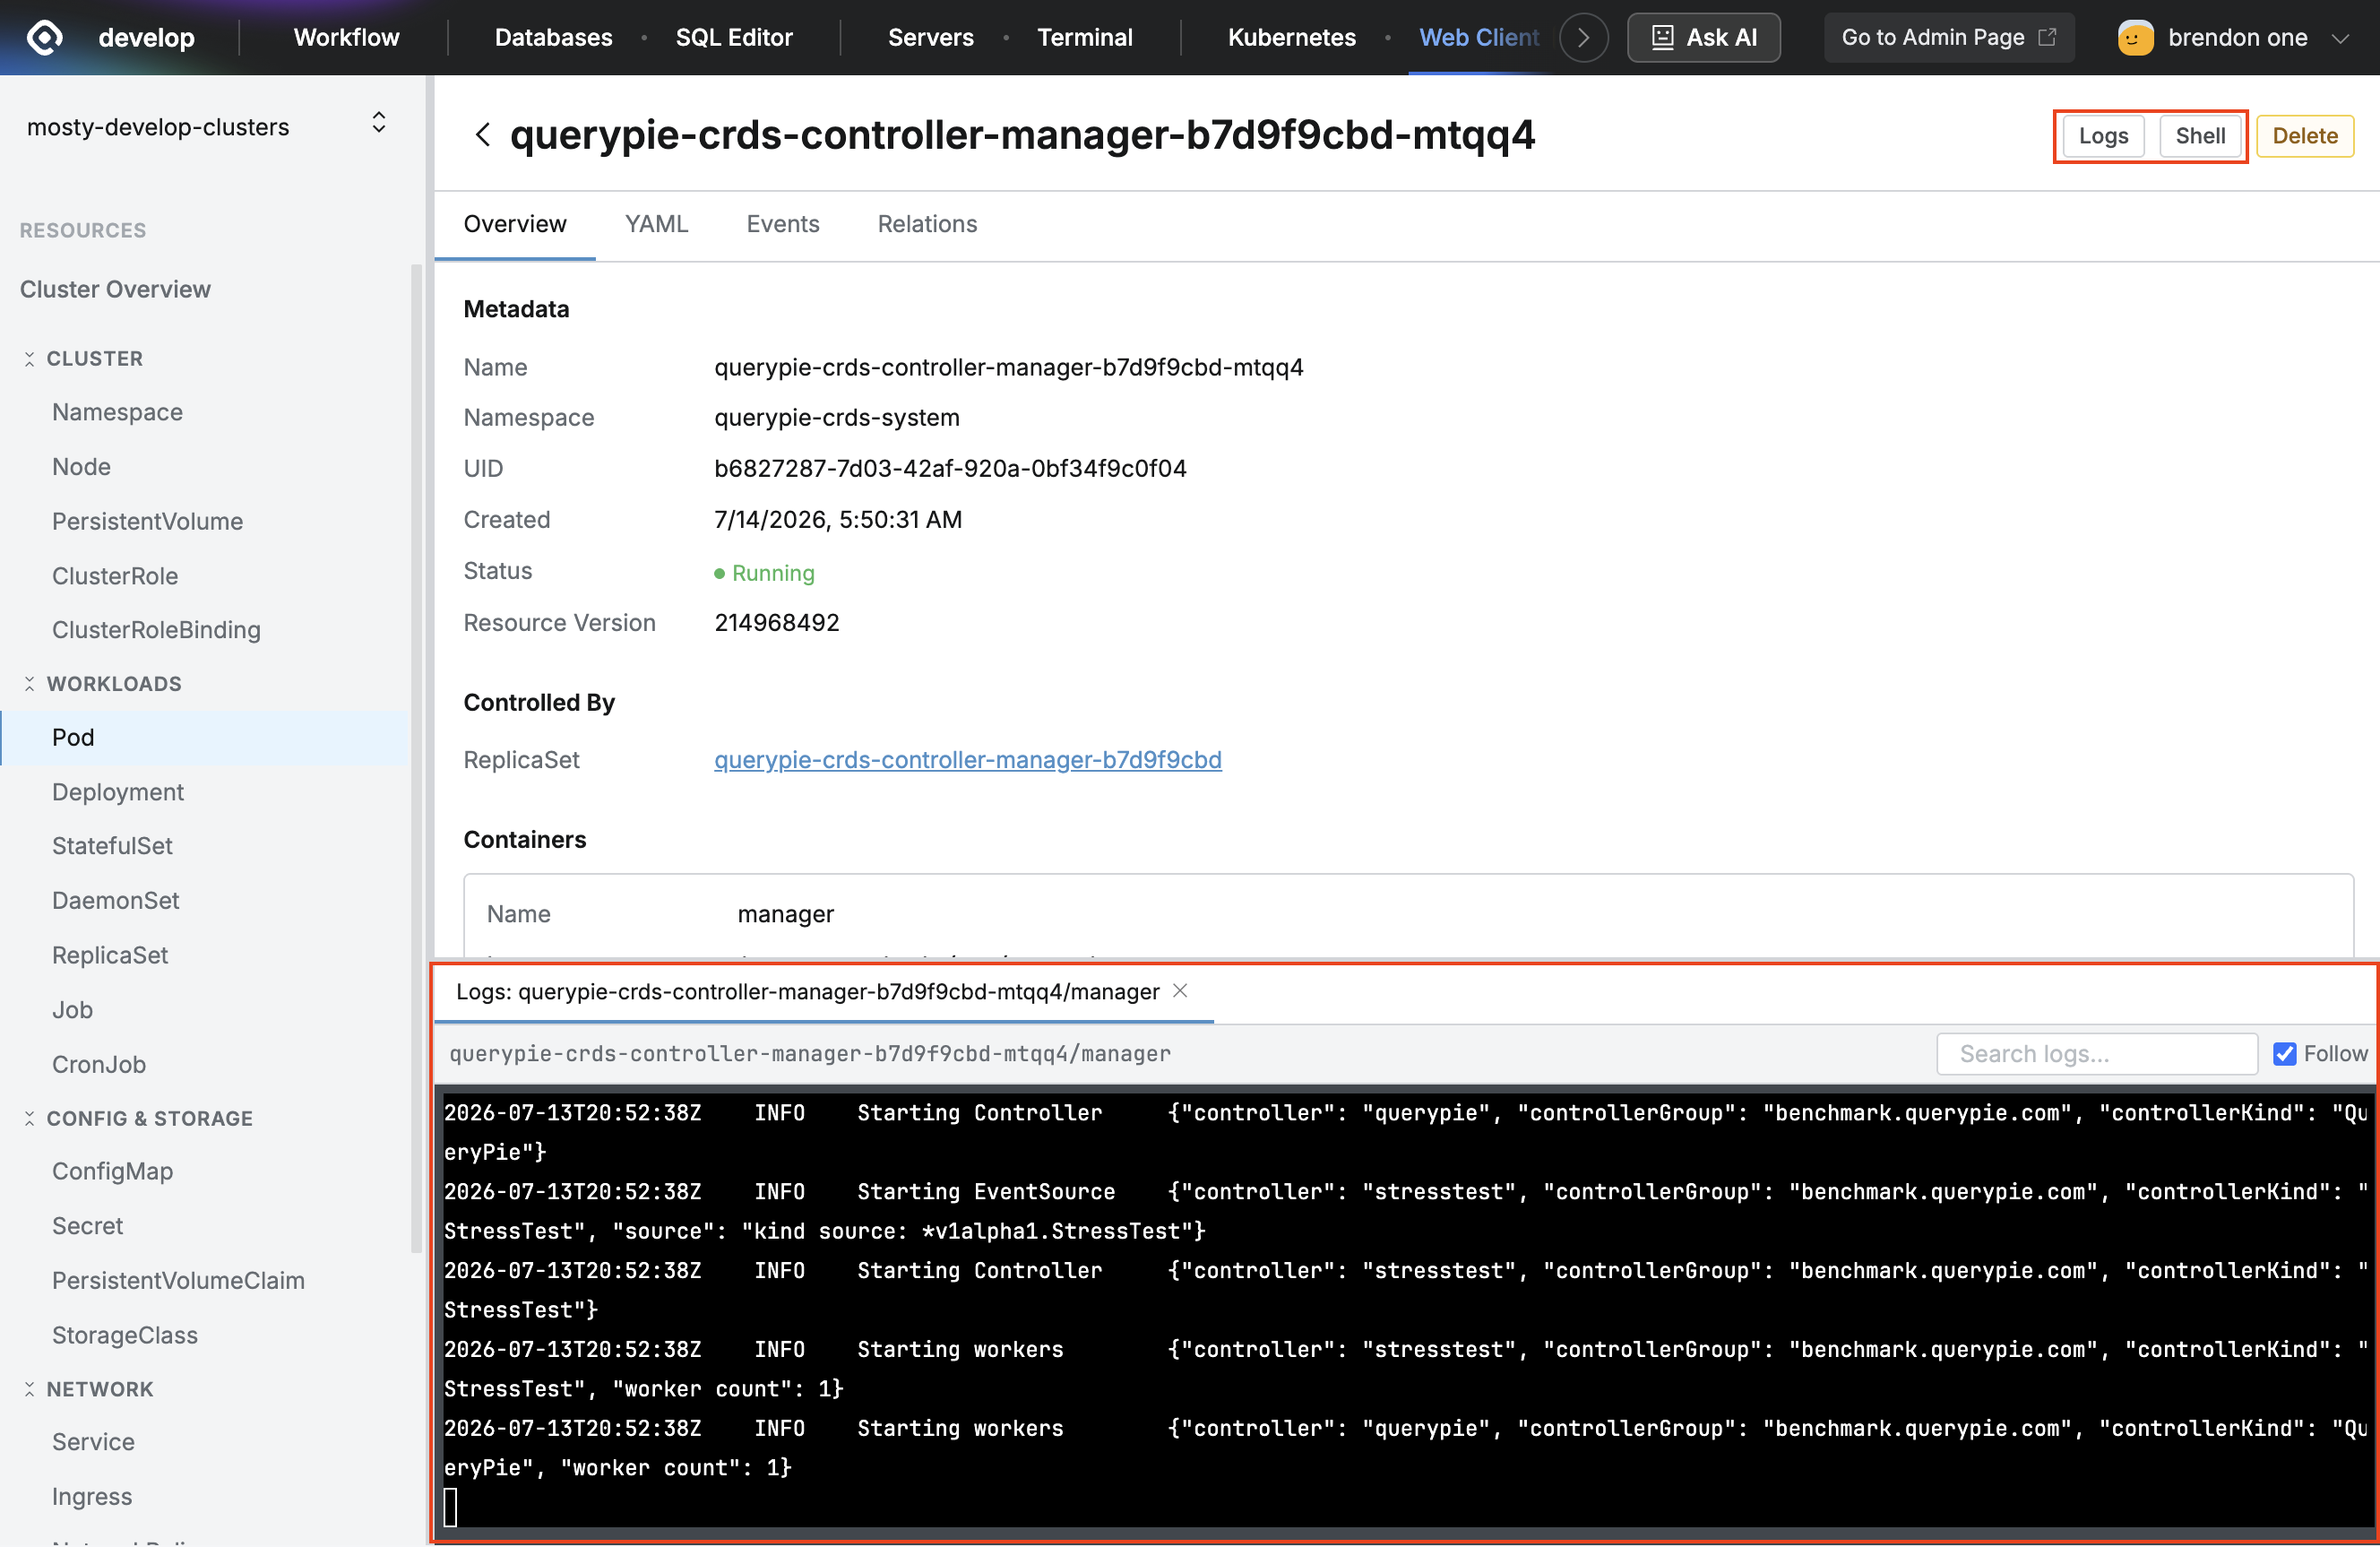
Bottom panel exposed as tabs when the
LogsorShellbutton is clicked
Connecting to a Cluster
Selecting a Role
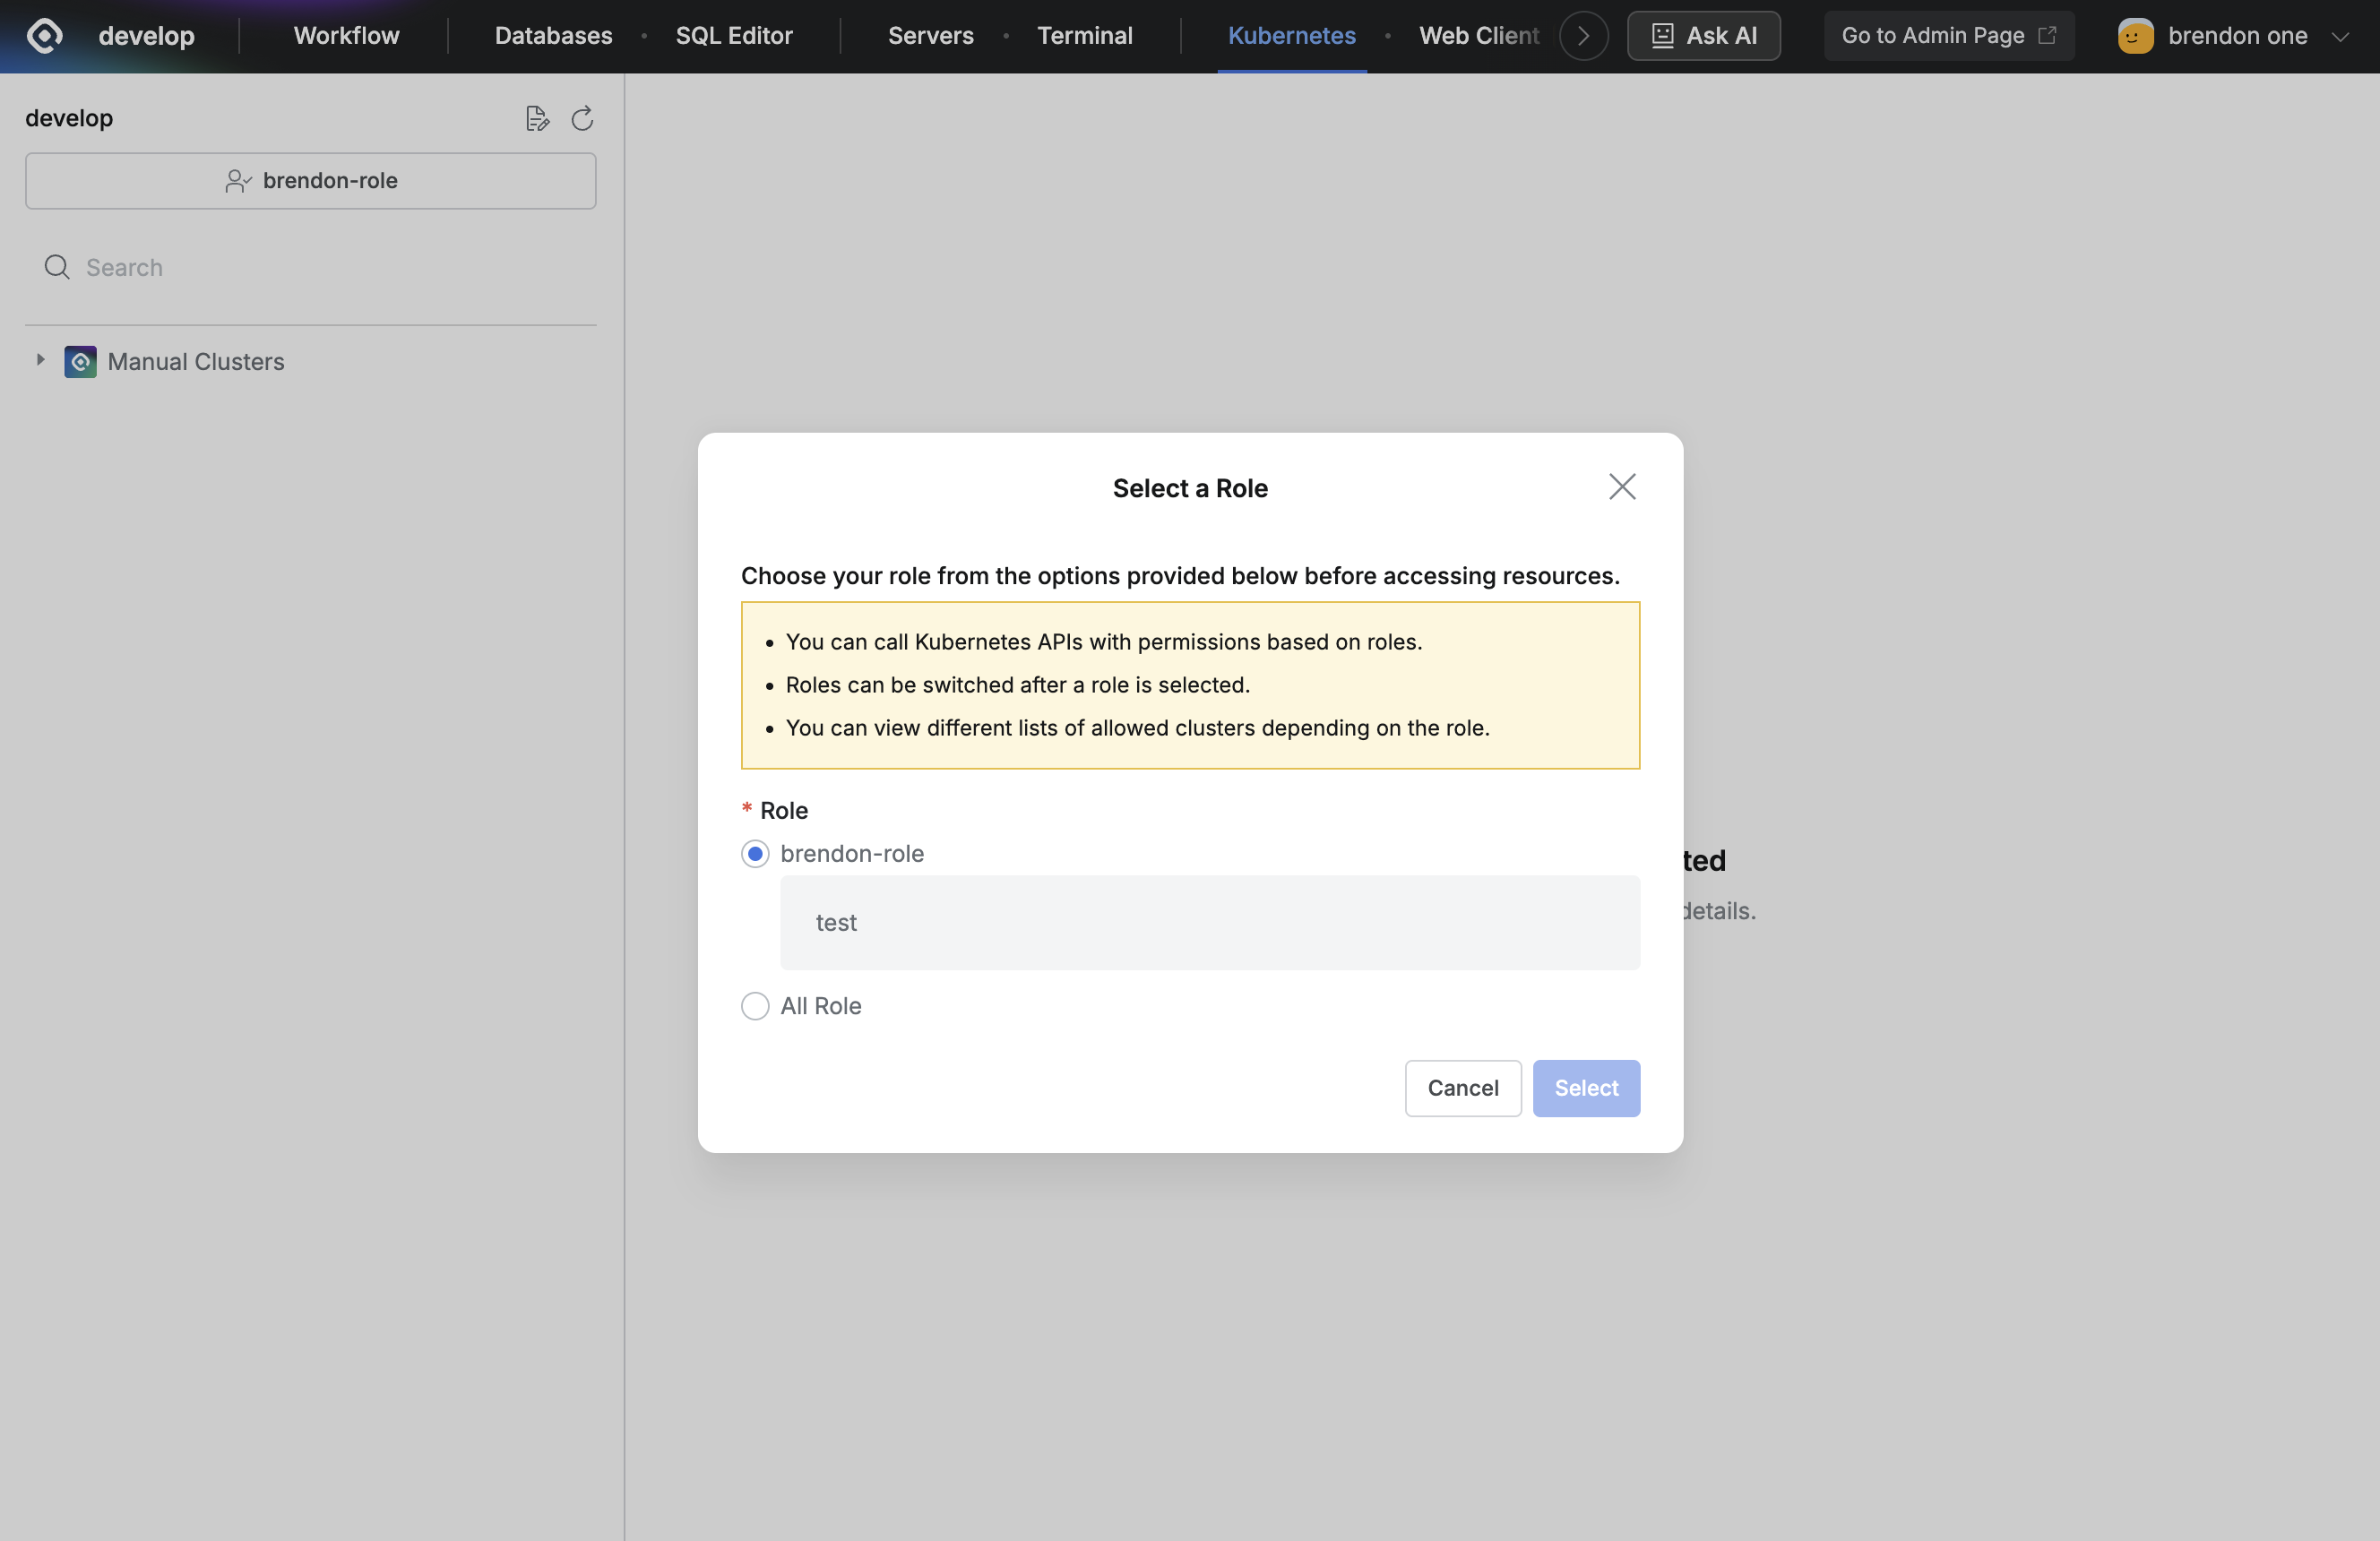
QueryPie Web > Kubernetes > Kubernetes > Select a Role
- Click Kubernetes in the top menu.
- In the Select a Role popup dialog, select the Role to use for access and click Select.
- The list of accessible clusters varies depending on the Role.
- If you do not have any granted Roles, the list on the left is not displayed. Request the appropriate permission through the Access Role Request form in the Workflow menu.
Connecting with Web Client
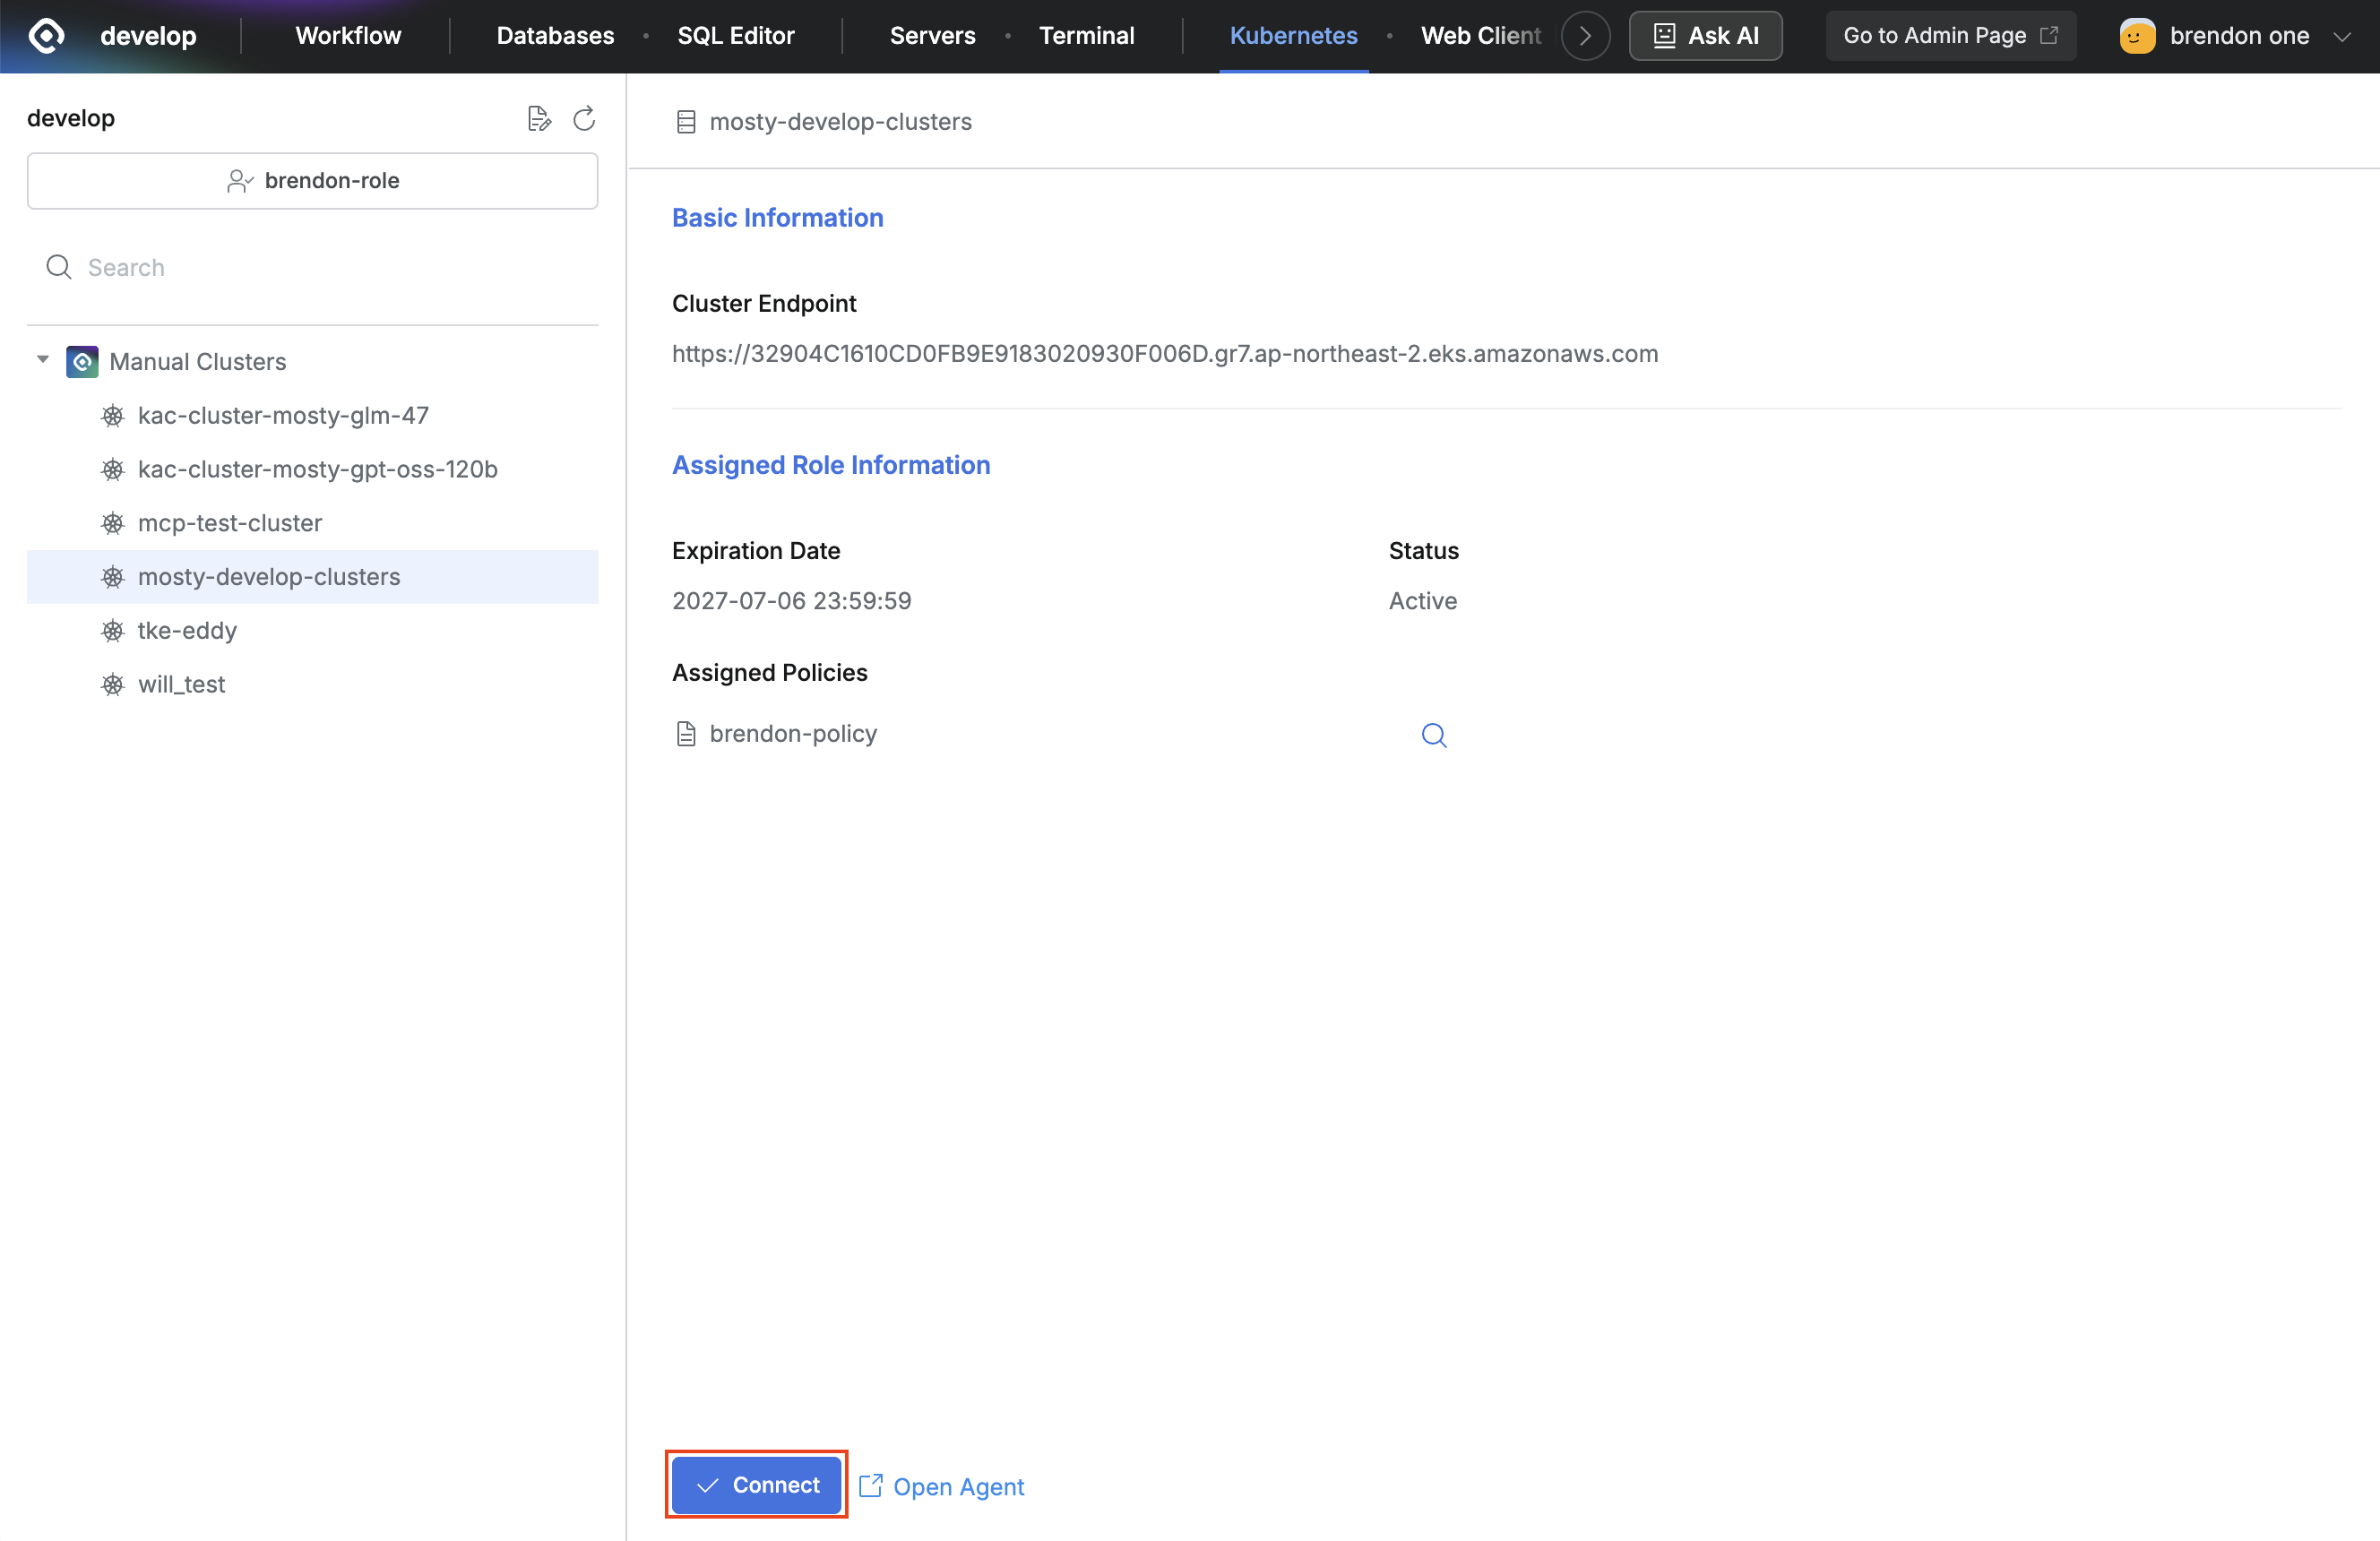
- Click the cluster you want to access in the left panel.
- Click the
Connectbutton on the detail screen on the right to connect with Web Client.
You can also connect using the existing Agent method by clicking the Open Agent button.
Refer to the Agent manual for Agent installation and usage.
Checking Resource Lists
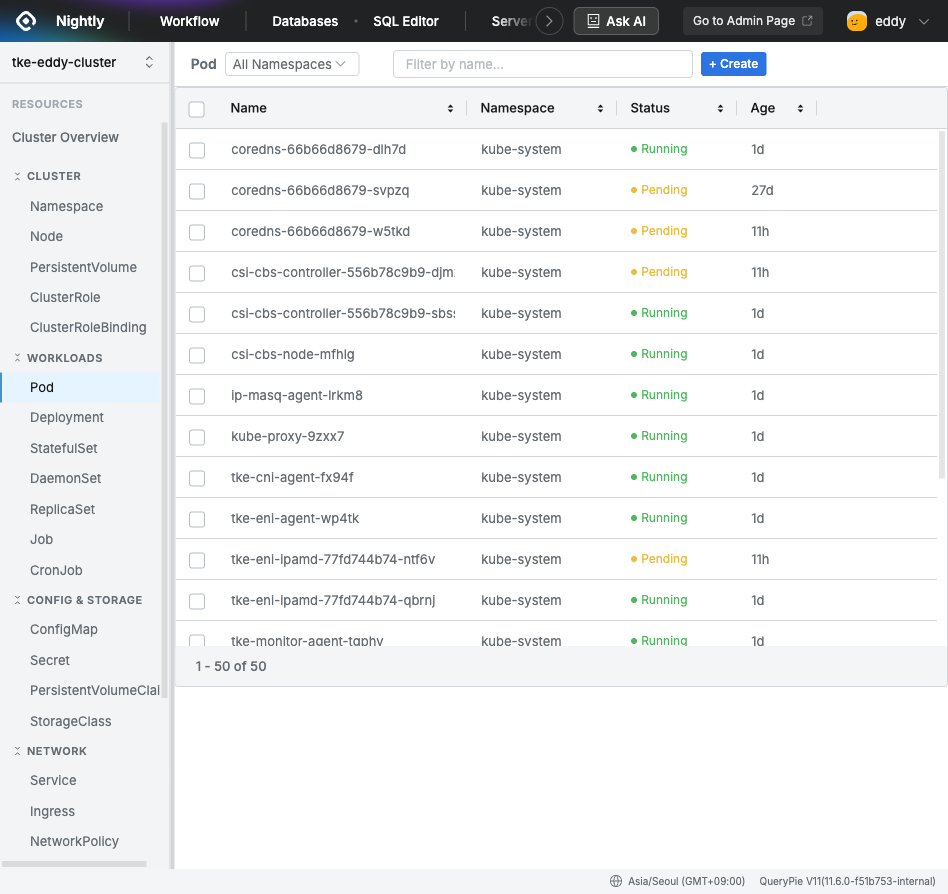
QueryPie Web > Web Client > Resource List
When you select a resource type in the left sidebar, the list of corresponding resources is displayed.
- You can select a specific Namespace from the All Namespaces dropdown to filter the list.
- You can search resources by entering part of a name in the Filter by name search field.
- You can create a new resource using the
+ Createbutton.
The resource categories that can be browsed are as follows.
| Category | Included Resources |
|---|---|
| Cluster | Namespace, Node, PersistentVolume, ClusterRole, ClusterRoleBinding |
| Workloads | Pod, Deployment, StatefulSet, DaemonSet, ReplicaSet, Job, CronJob |
| Config & Storage | ConfigMap, Secret, PersistentVolumeClaim, StorageClass |
| Network | Service, Ingress, NetworkPolicy, Endpoints |
| RBAC | Role, RoleBinding, ServiceAccount |
| Custom Resources | CRD resources defined in the cluster |
Checking Resource Details
Click an item in the resource list to open the detail panel on the right. The detail panel consists of four tabs.
Overview Tab
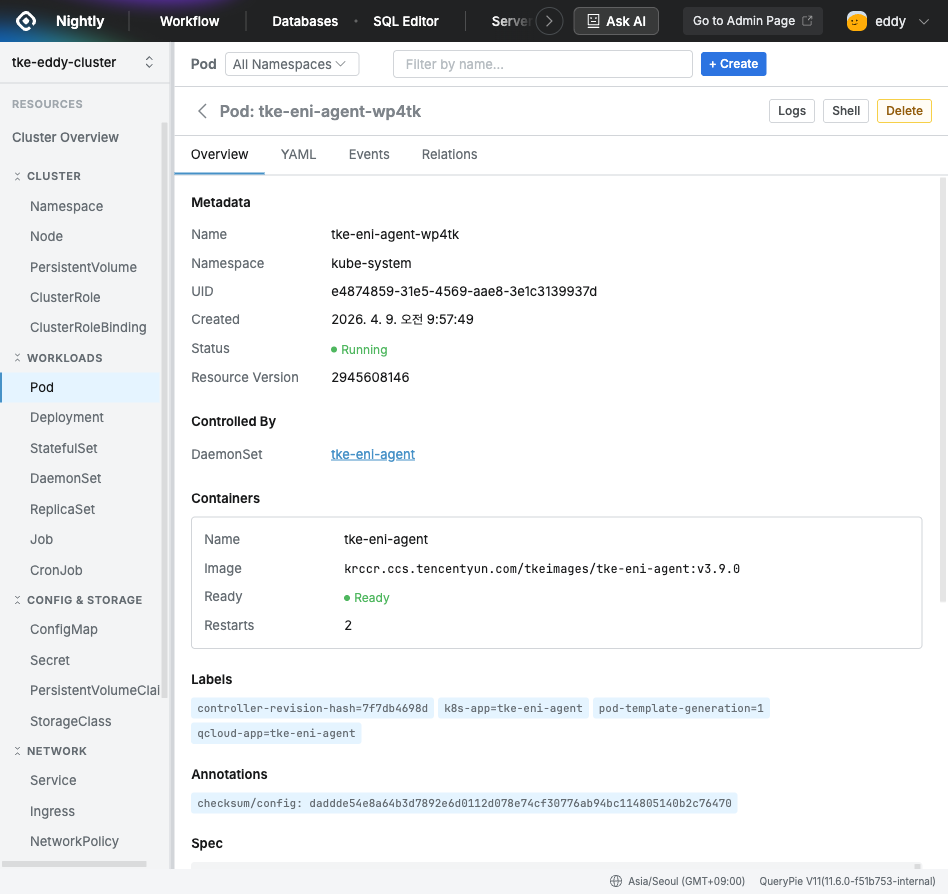
QueryPie Web > Web Client > Resource Detail > Overview
You can check the resource metadata and status.
- Metadata: Name, Namespace, UID, creation time, Status, Resource Version
- Controlled By: The parent resource that manages the resource (for example, Pod → DaemonSet) - click the name to move to the parent resource detail screen.
- Containers: For Pods, you can check the image, Ready status, and number of Restarts by container.
- Labels / Annotations: Labels and annotations configured on the resource
YAML Tab
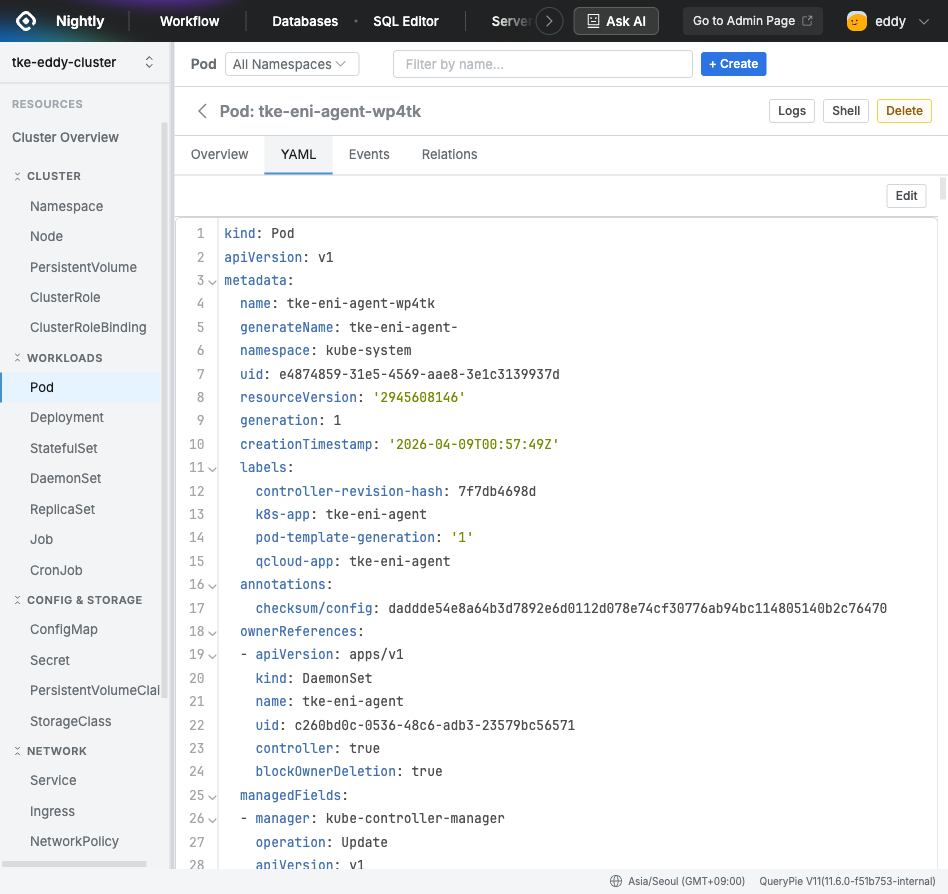
QueryPie Web > Web Client > Resource Detail > YAML
You can check the full YAML definition of the resource and edit it directly. Click the Edit button to switch to edit mode, and when you save after making changes, they are immediately applied to the cluster.
Events Tab
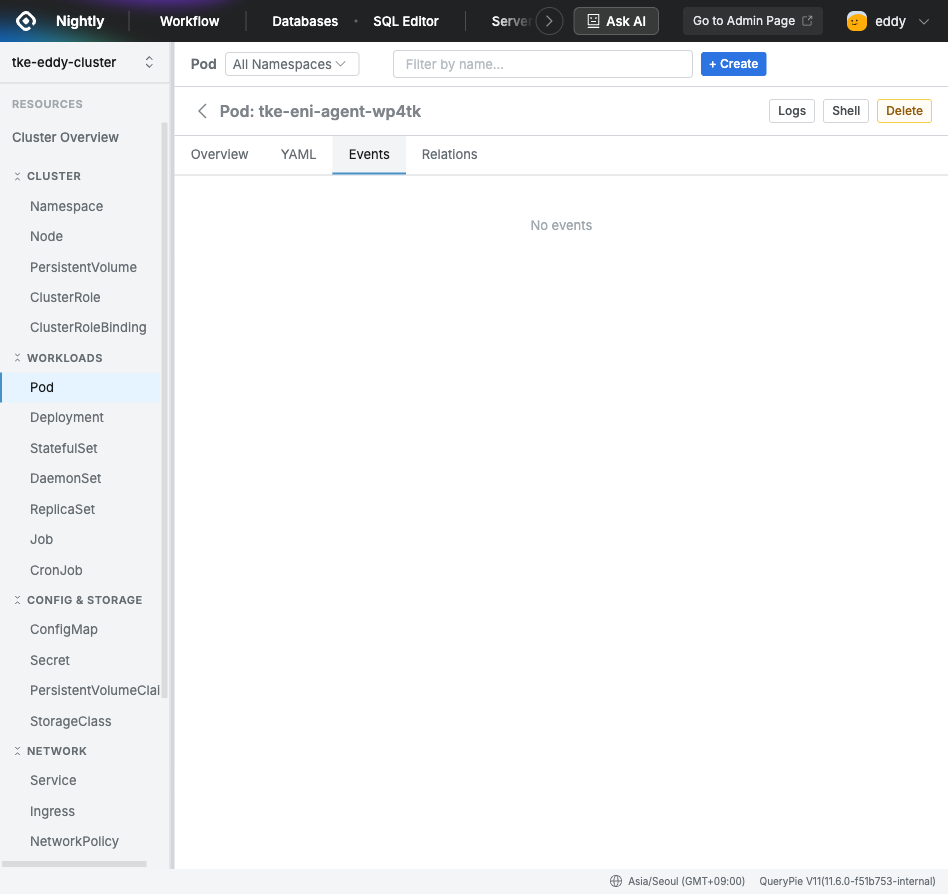
QueryPie Web > Web Client > Resource Detail > Events
You can check Kubernetes events related to the resource. Events are recorded when status changes, scheduling, or errors occur. If a Pod is running normally, there may be no events.
Relations Tab
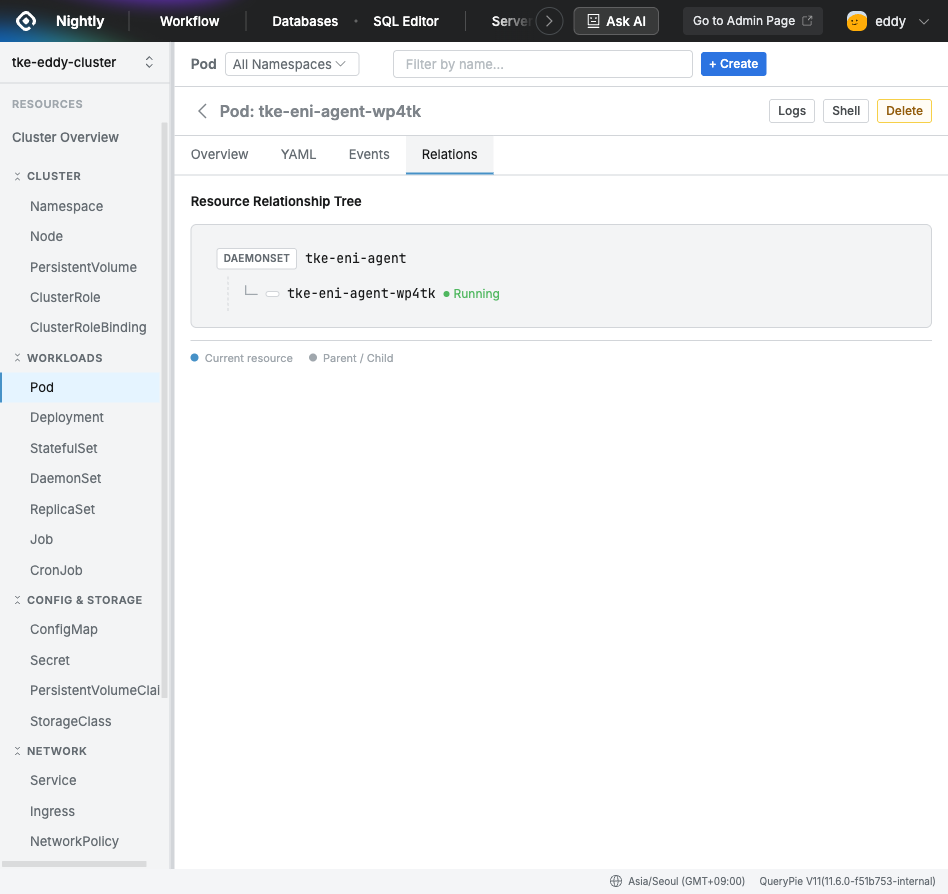
QueryPie Web > Web Client > Resource Detail > Relations
Visualizes the hierarchy of resources related to the current resource in a tree format. You can understand parent and child resource relationships at a glance, and click an item to move directly to the detail information of the related resource.
Checking Pod Logs
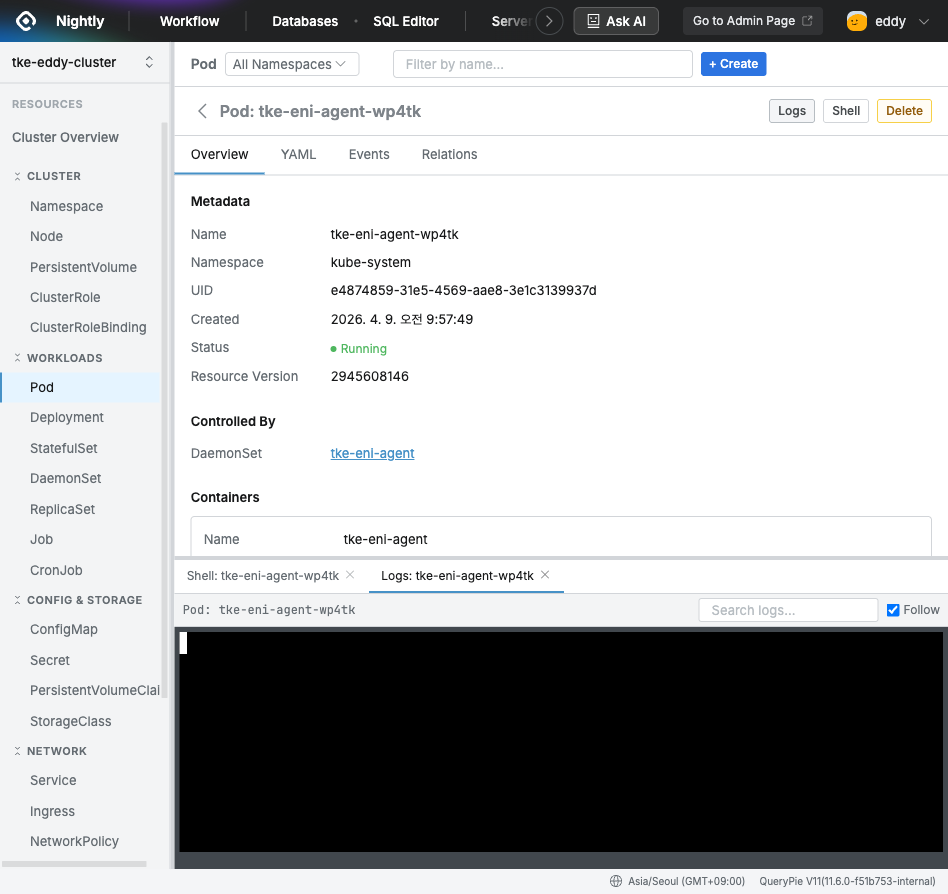
QueryPie Web > Web Client > Log Viewer
- Select Pod in the sidebar, and then click the Pod you want to check in the list.
- Click the Logs button in the upper right of the detail panel.
- The real-time logs of the corresponding Pod are streamed in the bottom panel.
- You can search logs by entering a keyword in the Search logs input field.
- Select the Follow checkbox to automatically follow the latest logs.
Connecting to a Pod Shell Terminal
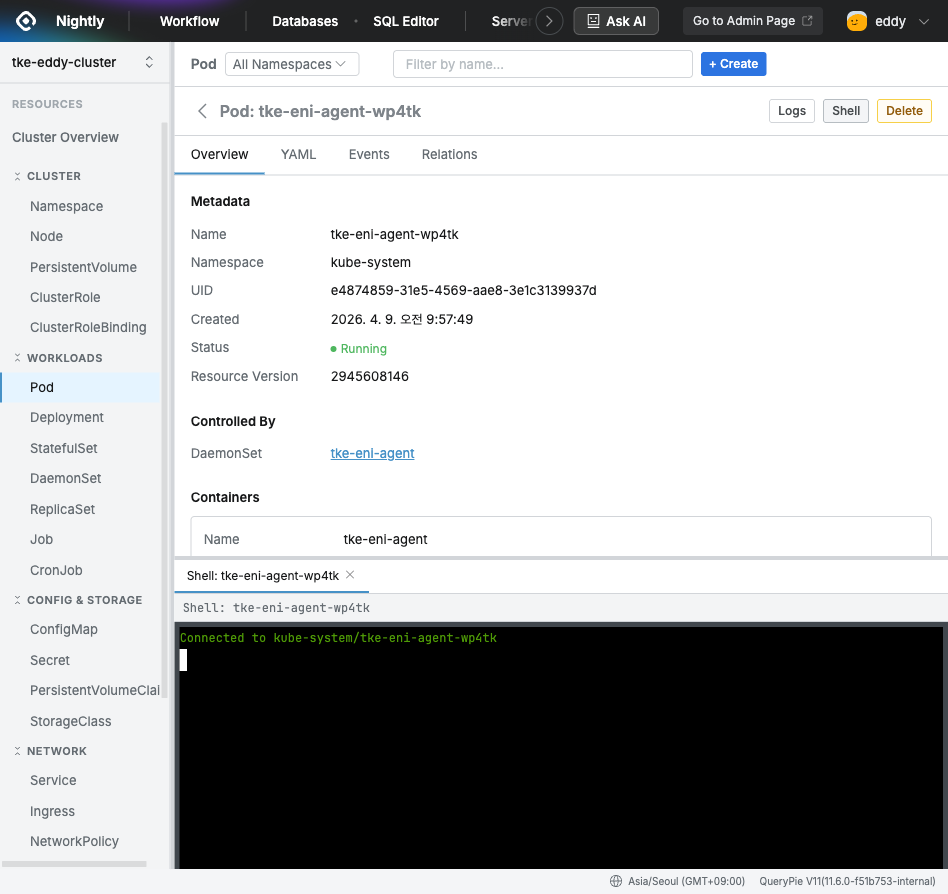
QueryPie Web > Web Client > Shell Terminal
- Select Pod in the sidebar, and then click the Pod you want to connect to in the list.
- Click the Shell button in the upper right of the detail panel.
- An interactive terminal opens in the bottom panel, where you can run commands directly in the Pod container.
Logs and Shell can be opened in multiple tabs at the same time. Each tab displays the Pod name, so you can compare and work with logs and terminals for multiple Pods together.
Difference between Web Client and the existing Agent method
Q. What is the difference between Web Client and the existing Agent method?
A. Web Client lets you browse Kubernetes resources, check logs, and access Shell using only a browser. The Agent method enables a wider range of work by integrating with local tools, including kubectl. Both methods operate under the same permission system (Role, Policy).