Operational Log Collection Guide
Overview
When you need to analyze an incident or provide information for technical support, collect operational logs and diagnostic data from the QueryPie server according to the symptoms. This document describes the basic logs to collect first in an operational environment, data to collect only when additionally required, and information to include when submitting the data.
Whenever possible, the basic collection should cover a range before and after the incident time. If the issue can be reproduced, record the reproduction time as well so that the logs can be compared more easily.
Basic collection items
When an issue requires analysis, collect the following four items first.
- QueryPie file logs
- Container standard output logs
/api/config/monitoringdump- Multi Agent or Windows Server Agent logs
You do not always need to collect every log for every symptom. However, if the potential cause has a broad scope or the issue is difficult to reproduce, it is best to collect all four basic items.
Collecting QueryPie file logs
File logs are application logs written by each component under /var/log/querypie.
The path inside the container is the same, but the path visible from the host may differ by version.
Checking the log path
- Check the QueryPie version.
- Check the log path on the host.
9.x ~ 10.4.x:/var/log/querypie11.0.x+: Generally thelogpath in the parent directory of the compose file
- If necessary, check the log path directly inside the app container.
The following example checks file logs directly from the host.
ls -al ../logIn an environment where the host path is /var/log/querypie, use the following command.
ls -al /var/log/querypieThe following example checks file logs inside the app container.
docker exec -it querypie-app-1 sh
ls -al /var/log/querypie
Compressing file logs
- Prepare a directory for collecting logs from before and after the incident time.
- Verify that logs related to
api,engine,nginx, andproxyare included. - Compress the logs using the path for your environment.
mkdir -p support-logs
tar -czf support-logs/querypie-file-logs.tar.gz -C .. log
In an environment where the host path is /var/log/querypie, collect the logs as follows.
mkdir -p support-logs
tar -czf support-logs/querypie-file-logs.tar.gz /var/log/querypie
Collecting container standard output logs
Along with file logs, collect the container’s stdout and stderr logs.
- Save the app container logs.
- If the
toolsprofile is running, save the tools logs as well.
mkdir -p support-logs
docker logs querypie-app-1 > support-logs/app.docker.log 2>&1
docker logs querypie-tools-1 > support-logs/tools.docker.log 2>&1 || true
When kill -3 is used as a thread dump fallback, the result is generally written to the container’s standard output. In this case, collecting docker logs is especially important.
Collecting a monitoring dump
For suspected API hangs, response delays, or deadlocks, use /api/config/monitoring first.
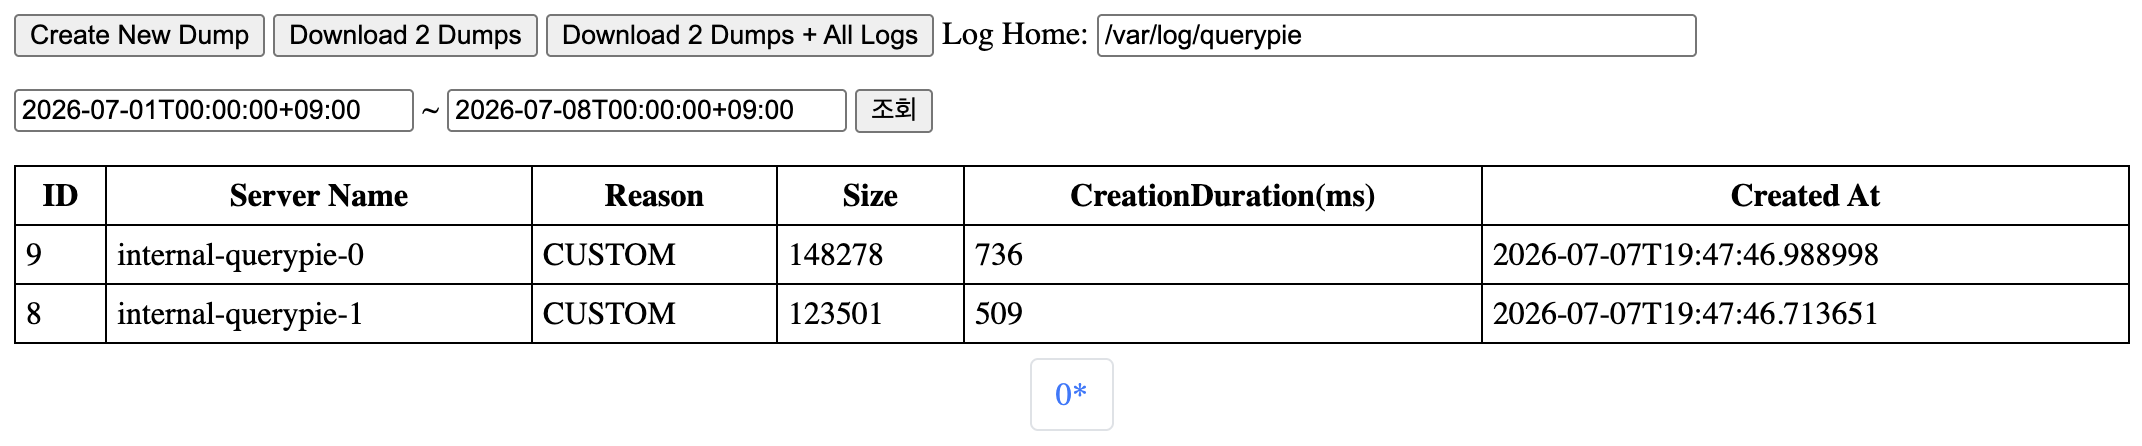
Example: https://<QueryPie address>/api/config/monitoring
- Sign in with the Owner account or an account with the
SYSTEM_PROPERTIESpermission. - In a browser, go to
/api/config/monitoring. - Check the required time range.
You can also clickCreate New Dumpto create a new dump file. - Select one of the following options.
- Download only the dump
- Download the dump and application logs together using
Dumps + All Logs
The default logHome value for Dumps + All Logs is /var/log/querypie.
If your environment uses a custom log path, verify the actual log home path before using this feature.
The monitoring dump archive includes thread.dump. Providing it together with the file logs significantly speeds up analysis.
When monitoring dumps are created automatically
A monitoring dump may be created automatically under the following conditions.
- The number of idle connections in the MetaDB or LogDB connection pool drops to 10% or less of the maximum pool size
- A
SQLTransientConnectionExceptionoccurs and its message containsConnection is not available, request timed out after
Automatic dumps are created at intervals of at least 10 minutes. Even if the same symptom repeats within a short time, a new dump may not be created each time.
Temporarily changing the log level
Only when the basic logs are insufficient to identify the cause, temporarily raise the log level to debug and collect reproduction logs.
- Record the time before changing the log level to debug.
- Raise the log level of the target component.
- Reproduce the same symptom.
- Collect the logs.
- Restore the original level.
- The default log level is
warnforapiandinfofor the other components:engine,arisa,cabinet,kubepie,rotatepie, andnovas. (arisais the proxy component.)
- The default log level is
docker exec -it querypie-app-1 /app/change-log-level.sh debug apiTo apply the setting to all components, omit the component.
docker exec -it querypie-app-1 /app/change-log-level.sh debugThe following components are supported.
apienginearisacabinetkubepierotatepienovasall
You can specify a timeout in seconds as the third argument.
Do not operate at debug level for an extended period. Always restore the original level after collection is complete.
docker exec -it querypie-app-1 /app/change-log-level.sh debug api 30
Logs to collect first by symptom
You do not always need to raise every component’s log level to debug. Use the following criteria to collect the logs that match the symptom first, and expand the scope only when necessary.
| Symptom / Scenario | Logs to collect first | Additional useful logs |
|---|---|---|
| Sign-in failure, screen API error, settings save failure, or approval request processing error | api file logs, docker logs querypie-app-1, and api debug logs if necessary | nginx logs |
| Web page does not open, 502/504 error, or static page appears but API calls fail | nginx file logs, docker logs querypie-app-1 | api file logs |
| DAC connection succeeds but query execution fails, or DB session creation or proxy connection is unstable | proxy file logs, arisa file logs | api logs and arisa debug logs if necessary |
| Slow query execution or results, engine processing failure, or snapshot/analysis processing issue | engine file logs | api logs, engine debug logs if necessary, monitoring dump |
| KAC cluster connection failure, Kubernetes resource query failure, or kubectl issue | kubepie file logs | api logs and kubepie debug logs if necessary |
| RotatePie scheduling or rotation processing issue | rotatepie file logs | rotatepie debug logs if necessary |
| Nova, SSH, or gateway integration connection failure | novas file logs | novas debug logs and related gateway logs if necessary |
| Multi Agent connection issue, local app connection failure, WebView error, or issue reproduced only on a specific user PC | Multi Agent logs, webView.log | Server-side proxy and api logs |
| SAC Windows Server Agent connection failure, RDP timeout, or issue reproduced only in a specific Windows session | Windows Server Agent service logs | Per-user Agent logs, Multi Agent logs, server-side proxy/api logs |
| Suspected API hang, response delay, deadlock, or insufficient DB connection pool | /api/config/monitoring dump, api file logs | engine logs, docker logs, thread dump fallback |
If you are unsure which logs to review first, collect api, nginx, docker logs, and the /api/config/monitoring dump. For connection or proxy issues, add proxy or arisa; for client issues, add Multi Agent or Windows Server Agent logs.
Collecting Multi Agent logs
If the environment uses Multi Agent, collect the desktop app logs as well.
- Check the log path for the operating system in use.
- Windows:
%USERPROFILE%\.querypie-multi-agent\logs\ - macOS:
$HOME/.querypie-multi-agent/logs/ - Linux:
$HOME/.querypie-multi-agent/logs/
- Windows:
- Collect the general logs and
webView.log. - If detailed logs are required, turn on
Diagnostic Tools > Enable Tracing, then reproduce the issue. - Turn tracing off again after collection.
- If necessary, use
Diagnostic Tools > Export Logto create an archive.
Use the QPMA_TRACE=1 environment variable only when detailed logs are required from application startup.
Avoid using it for an extended period during normal operation.
Collecting SAC Windows Server Agent logs
If the environment uses Windows Server Agent with SAC, collect the agent logs as well.
Collecting basic service logs
- Check the following path on the Windows Server.
%ProgramData%\QueryPie\Server Agent\Logs\
- Compress the service logs first.
$logRoot = "$env:ProgramData\QueryPie\Server Agent\Logs"
$outFile = "$env:TEMP\querypie-server-agent-logs.zip"
Compress-Archive -Path "$logRoot\*" -DestinationPath $outFile -Force
When per-user logs are required
If the issue is reproduced only in a specific Windows user session or you need to check per-user behavior, collect the following path as well.
%ProgramData%\QueryPie\Server Agent\Logs\Users\<WindowsUser>\
When verbose logs are required
- Open PowerShell on the Windows Server.
- Check the current LogLevel.
Get-ItemProperty "HKLM:\SYSTEM\CurrentControlSet\Services\QueryPie Server Agent Persistent" | Select-Object LogLevel- If necessary, change LogLevel to
Verbose.
Set-ItemProperty "HKLM:\SYSTEM\CurrentControlSet\Services\QueryPie Server Agent Persistent" -Name "LogLevel" -Value "Verbose"- Reproduce the symptom and collect the logs.
- Restore it to
Informationafter collection.
Set-ItemProperty "HKLM:\SYSTEM\CurrentControlSet\Services\QueryPie Server Agent Persistent" -Name "LogLevel" -Value "Information"When tracing an RDP timeout or connection failure, include the QueryPie server-side Proxy/API logs and the Multi Agent logs from the user’s PC to make analysis easier.
Collecting additional data only when required
Collect the following data only when you need to analyze a configuration issue, deployment difference, or thread dump fallback.
Collecting configuration files
- Check the current deployment configuration files.
- Mask sensitive information before submitting them.
Examples of additional items to collect include the following.
.envorcompose-envcompose.ymlordocker-compose.ymlnginx.d/- Custom configuration files
logrotate.d/querypie
In some compose packages, logrotate.d/querypie may be directly linked to the app container’s /etc/logrotate.d/querypie configuration.
Include it only when you need to check log rotation behavior or the retention period.
Collecting a JVM thread dump as a fallback
Use this only when /api/config/monitoring is difficult to access or you need to collect a thread dump directly inside the container.
- Connect to the app container from the host.
docker exec -it querypie-app-1 bash- Find the API Java PID inside the app container and create a thread dump.
ps -ef | grep '[a]pp/api/api.jar'- If available, collect the thread dump using
jcmd.
jcmd <PID> Thread.print > /tmp/api-thread-dump.txt- Exit the app container, then copy the dump file from the host.
docker cp querypie-app-1:/tmp/api-thread-dump.txt support-logs/api-thread-dump.txt- If
jcmdis unavailable, usekill -3inside the app container.
kill -3 <PID>For this step, use the PID of the /app/api/api.jar process, not commandpie-engine.jar.
Information to include when submitting logs
Providing log files alone can increase the analysis time, so include the following information.
| Item | Description |
|---|---|
| Time of occurrence | Example: 2026-07-07 14:23 KST |
| Server timezone | Reference for comparing log timestamps |
| Symptom | Example: A specific API response takes more than 30 seconds after login |
| Reproducibility | Reproducible / Not reproducible |
| Reproduction steps | Record step by step when possible |
| Reproduction time | Actual time when the reproduction was performed |
| Impact scope | Whether it affects a specific user, a specific server, or all users |
| Collected log types | File logs, docker logs, monitoring dump, agent logs, and so on |
Checklist template
[Basic Information]
- Time of occurrence:
- Server timezone:
- Symptom:
- Impact scope:
[Reproduction Information]
- Reproducibility:
- Reproduction steps:
- Reproduction time:
[Collected Logs]
- File logs: Collected / Not collected
- docker logs: Collected / Not collected
- monitoring dump: Collected / Not collected
- Multi Agent logs: Not applicable / Collected / Not collected
- Windows Server Agent logs: Not applicable / Collected / Not collected
[Additional Collection]
- Configuration files: Collected / Not collected
- JVM thread dump fallback: Collected / Not collected
[Additional Notes]
- Notes: